What Is a Data Lakehouse? (And How It Differs from a Warehouse)
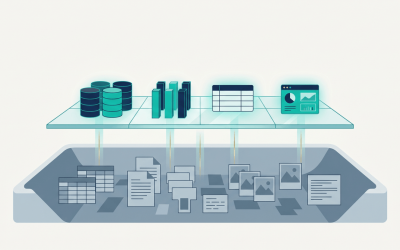
A data lakehouse is the newest architecture in modern analytics. It combines the low-cost storage of a data lake with the structure, governance, and performance of a data warehouse, all in a single platform. For Houston businesses already running on Microsoft Fabric or considering a move to it, the lakehouse is the architectural pattern underneath the entire experience, and understanding it matters more than most leaders realize.