Charts in Microsoft Fabric

Charts in Microsoft Fabric

Visual Clarity with Fabric-Integrated Charts

Charts in Microsoft Fabric unify your data into sleek, real-time visuals. From KPIs to forecasts, Allston Yale helps teams transform raw metrics into meaningful insights; all within Microsoft’s end-to-end platform.

Allston Yale Serves Businesses in Texas and across the USA

Visualize Data Across the Fabric Stack

Charts in Microsoft Fabric are built using Power BI and supported across the Fabric ecosystem. Whether your data originates from Synapse, OneLake, or Data Factory, visuals remain updated and dynamic. These role-based views enable accurate, data-driven collaboration enterprise-wide.

Unified Visuals, Smarter Dashboards

Charts in Microsoft Fabric combine real-time data with smart design, giving your teams role-based dashboards that update instantly. Visuals stay synced, clear, and ready for action.

  • Real-time visuals from multiple sources - Allston Yale

    Real-time visuals from multiple sources

    Fabric charts pull live data from diverse tools (e.g. Data Factory, OneLake, Synapse) and display synchronized insights across Power BI dashboards. Teams access updates instantly without needing manual refreshes.

  • Embedded AI suggestions for chart types - Allston Yale

    Embedded AI suggestions for chart types

    Microsoft Fabric’s AI-enhanced reporting recommends optimal visualizations based on your data. These smart suggestions speed up design and improve how insights are communicated across stakeholder levels.

  • Native integration with Lakehouse and OneLake - Allston Yale

    Native integration with Power BI visuals

    Fabric charts use Power BI’s full visualization library, ensuring every chart aligns with best practices in dashboard design while offering customization that fits any reporting use case.

  • Easier collaboration with Microsoft 365 apps - Allston Yale

    Easier collaboration with Microsoft 365 apps

    Charts created in Fabric are easily shared in Teams, embedded in SharePoint, and reviewed through Excel. This seamless connection accelerates collaboration across technical and non-technical users.

  • Seamless collaboration through Microsoft 365 - Allston Yale

    Simplified governance with centralized data controls

    With Microsoft Fabric, your charts inherit secure governance from OneLake, enabling access control, audit tracking, and data lineage from a single point of truth.

Charts for Every Business Question

Allston Yale designs Microsoft Fabric chart libraries that align with operational needs and strategic goals. Each chart is selected for clarity, performance, and relevance.

  • Bar & Column Charts

    Visualize KPIs like sales by department or service delivery by region. Great for comparing performance across timeframes or categories in a clear format.

  • Line Charts

    Plot trends such as customer growth, system load, or marketing impact. Track movement over time to forecast and respond quickly to change.

  • Pie Charts

    Highlight proportional data such as revenue share by product line or customer distribution by market segment, offering easy-to-grasp overviews.

  • Waterfall Charts

    Break down value changes like net profit, cost variance, or departmental expenses. Helps illustrate how each step contributes to a final total.

  • Scatter Plots

    Reveal hidden patterns: such as customer age vs. spending or defect rate vs. operator hours. Ideal for spotting outliers and correlations.

  • TreeMaps

    Display hierarchical data visually, like budget by business unit or inventory by category. Area size indicates importance, adding clarity at a glance.

  • Decomposition Trees

    Allow users to drill into metrics step-by-step. Explore drivers behind key indicators like revenue dips or service delays interactively.

  • Gauge Charts

    Monitor progress toward business goals like production uptime or sales quota attainment. Useful for executives who need a fast performance snapshot.

Industry Insights at a Glance

Microsoft Fabric charts allow Allston Yale to design dashboards that speak your sector’s language: clear visuals, real metrics, fast decisions.

  • Manufacturing

    Track throughput, downtime, and yield across shifts or sites. Visuals surface where processes slow and improvements can be made.

  • Energy & Utilities

    Map asset health, energy usage, or outage locations in real time. Quickly pinpoint anomalies that impact operations or safety.

  • Finance

    Visualize cash flow, risk levels, and profitability by division. Dashboards help CFOs and analysts make timely, risk-aware decisions.

  • Healthcare

    Monitor patient loads, treatment timelines, and scheduling gaps. Charts keep clinical and administrative teams aligned in care delivery.

  • Construction

    Stay on top of project milestones, budgets, and contractor performance. Visuals simplify timeline tracking and budget control.

  • Retail

    Assess foot traffic, online conversion rates, and product-level inventory. Gain insights into buyer behavior and sales trends across locations.

Solving the Charting Bottlenecks

Microsoft Fabric charts resolve the limitations of legacy tools by unifying visuals, speeding up reporting, and improving data fluency.

  • Disconnected visuals across teams - Allston Yale

    Disconnected visuals across teams

    Teams using separate tools often lose alignment. Fabric connects them under one platform, keeping everyone on the same visual page.

  • Slow updates from fragmented data sources - Allston Yale

    Slow updates from fragmented data sources

    Real-time integration means dashboards update instantly, no more chasing CSVs or waiting on weekly batch uploads.

  • Inconsistent formats across departments

    Inconsistent formats across departments

    Allston Yale standardizes chart design and metrics, so dashboards feel familiar regardless of function or user.

  • Manual chart-building in spreadsheets - Allston Yale

    Manual chart-building in spreadsheets

    Automated visuals replace manual Excel work, saving hours while improving data accuracy and visual polish.

  • Siloed insights that hinder enterprise agility - Allston Yale

    Limited drill-down or real-time interactivity

    Fabric’s advanced visuals support filtering, drill-through, and live exploration; giving users control, not just snapshots.

Charts in Microsoft Fabric Built for Action

Charts in Microsoft Fabric give you the edge with clear, scalable, and secure reporting. At Allston Yale, we design tailored chart libraries that bring your KPIs to life, from executive scorecards to department-level dashboards. Book your consultation today and put your data to work. 

Copilot in Microsoft Fabric

Copilot in Microsoft Fabric

Revolutionize Your Workflow with AI Guidance

Copilot in Microsoft Fabric empowers users to navigate complex datasets, automate repetitive tasks, and generate actionable insights faster. This knowledgebase page guides you through its features, helping your team harness AI to improve analytics efficiency and decision-making.

Make sense of your business data with clear, interactive visuals. This page explains what is Power BI, how it works, and why Allston Yale recommends it for any organization seeking actionable insight and informed strategy.

Allston Yale Serves Businesses in Texas and across the USA

What Is Copilot in Microsoft Fabric

Copilot in Microsoft Fabric is an AI-powered assistant embedded in Microsoft Fabric, enabling natural language queries, automated analytics, and predictive insights. Users can create reports, dataflows, and visualizations efficiently, reducing manual effort while increasing data accuracy.

AI Analytic Features Across Multiple Tools

Understanding how Copilot integrates with Microsoft Fabric can be enhanced by comparing its capabilities with other analytics tools. The table below highlights key features, helping users see the unique advantages and workflow efficiencies Copilot delivers.

.bi-table-wrapper { overflow-x: auto; max-width: 100%; } .bi-table { width: 100%; min-width: 750px; border-collapse: collapse; margin: auto; background-color: #fff; color: black; box-shadow: 0 0 10px rgba(0,0,0,0.1); } .bi-table caption { caption-side: top; font-size: 1.6rem; font-weight: bold; padding: 1rem; color: #00897F; text-align: center; } .bi-table th, .bi-table td { padding: 12px 20px; text-align: left; border-bottom: 1px solid #ddd; vertical-align: top; } .bi-table th { background-color: #00897F; color: white; text-align: center; } .bi-table tr:hover { background-color: #f1f1f1; } .bi-table tbody tr:nth-child(even) { background-color: #f9f9f9; } @media (max-width: 600px) { .bi-table { min-width: 100%; } .bi-table caption { font-size: 1.2rem; padding: 0.75rem; } .bi-table th, .bi-table td { padding: 8px 10px; font-size: 0.9rem; } }
Microsoft Fabric Copilot vs Standard Analytics Tools
Feature Microsoft Fabric Copilot Standard Analytics Tools
Natural Language Queries Users ask questions in plain English to generate insights instantly Typically requires manual query construction, slowing workflow.
Automated Dataflows Creates pipelines automatically from datasets, reducing setup time Users must manually configure ETL processes.
Predictive Insights Provides forecasts and trend analyses based on AI models Predictive features often require separate AI modules.
Visualization Generation Automatically suggests charts, dashboards, and reports Visualizations must be manually created from scratch.
Collaboration Integration Works within workspaces, allowing teams to share AI-driven insights Collaboration limited to standard sharing features without AI support.
  • Natural Language Queries

    Natural Language Queries

    Copilot lets users ask questions in plain English to generate instant insights, eliminating complex query writing and speeding analysis. Standard tools usually require manual query construction, slowing workflow efficiency and increasing error risk.

  • Automated Dataflows

    Automated Dataflows

    Copilot automates pipeline creation from datasets, reducing manual ETL setup and freeing teams to focus on analytics strategy. Traditional analytics tools require configuring each step manually, which can be time-consuming and error-prone.

  • Predictive Insights

    Predictive Insights

    AI-driven forecasts and trend analyses in Copilot help teams anticipate changes, optimize planning, and make data-driven decisions. Standard tools often need separate predictive modules, delaying insights and requiring advanced expertise.

  • Visualization Generation

    Visualization Generation

    Copilot suggests charts, dashboards, and reports automatically, allowing users to visualize data faster and more effectively. Standard analytics tools require users to manually create visualizations, slowing workflow and increasing the risk of misrepresentation.

  • Collaboration Integration

    Collaboration Integration

    Copilot works within Fabric workspaces, letting teams share AI-generated insights in real-time for seamless collaboration. Standard analytics tools often lack AI-assisted collaboration features, making team communication less efficient and insight sharing slower.

Advantages of Leveraging Copilot Services

Allston Yale helps teams fully implement Copilot in Microsoft Fabric, optimizing workflows and maximizing ROI. Our services ensure proper setup, user training, and best practices for analytics, enabling organizations to extract actionable insights efficiently.

  • Faster Insights

    Copilot in Microsoft Fabric accelerates report creation, data analysis, and visualization, allowing teams to quickly transform raw data into actionable business decisions. By reducing the time from data collection to insight, Copilot enhances operational efficiency.

  • Error Reduction

    AI-powered guidance from Copilot helps minimize human errors during data entry, transformation, and analysis. This ensures datasets remain accurate, reliable, and trustworthy, supporting high-quality insights and consistent decision-making across the enterprise.

  • Enhanced Collaboration

    Copilot-generated insights can be shared easily within Fabric workspaces, fostering better communication and coordination across teams and departments. This seamless collaboration ensures unified analytics efforts and faster, more informed decisions.

  • Predictive Analytics

    Copilot leverages AI to identify trends, generate forecasts, and reveal hidden patterns in data. By providing forward-looking insights, it empowers teams to anticipate changes, plan proactively, and implement strategic initiatives with confidence.

  • User Empowerment

    Through Allston Yale’s training and guidance, teams learn to utilize Copilot effectively, increasing adoption and confidence. This ensures AI-powered features are leveraged fully, improving workflow efficiency and enabling teams to achieve better outcomes.

Fly High with Ease with Copilot in Microsoft Fabric

Allston Yale’s Copilot services transform how organizations interact with data, combining AI assistance, streamlined workflows, and expert guidance. Explore Copilot in Microsoft Fabric today to enhance analytics efficiency, reduce errors, and gain actionable insights. Book your consultation now.

Sources

Features of Microsoft Fabric

Features of Microsoft Fabric

Unleash the Power of Microsoft Fabric Features

Microsoft Fabric offers a unified analytics platform that empowers businesses to streamline data access, governance, and insights. This page explores the core features of Microsoft Fabric, helping teams understand its capabilities and why it drives smarter enterprise decisions.

Make sense of your business data with clear, interactive visuals. This page explains what is Power BI, how it works, and why Allston Yale recommends it for any organization seeking actionable insight and informed strategy.

Allston Yale Serves Businesses in Texas and across the USA

What Microsoft Fabric Offers

Microsoft Fabric integrates storage, compute, and analytics in a single environment. Its features include OneLake storage, integrated AI, shortcuts, and cross-platform connectivity. By centralizing workloads, Fabric ensures seamless collaboration, faster insights, and reduced infrastructure complexity

Features Deep Dive

To illustrate how features of Microsoft Fabric improve data operations, the following table compares major functionality with traditional solutions, showing the value of Fabric’s unified approach source: 

Microsoft Fabric Key Features
Feature Description Advantage
OneLake Storage Centralized storage for all data sources Provides a single source of truth across clouds and accounts
Shortcuts Pointers to external/internal storage locations Enables direct access to data without duplication, improving performance
Integrated AI AI models embedded in Fabric workloads Allows predictive analytics directly on datasets, streamlining insights
Unified Permissions Centralized access control Simplifies security management and reduces credential redundancy
Cross-Platform Connectivity Connects Azure, AWS, and other clouds Facilitates seamless data integration across platforms (Azure Synapse Analytics Overview)
Data Governance Built-in compliance and lineage tools Enhances data quality and regulatory compliance (Microsoft Fabric Benefits)
  • OneLake Storage

    OneLake Storage

    OneLake shortcuts let users access all enterprise data through a unified namespace without configuring each workload separately. This centralization simplifies analytics, reduces setup time, and ensures consistent access across all Fabric services.

  • Shortcuts

    Shortcuts

    Allow teams to access external or internal data directly through OneLake, avoiding unnecessary copies, saving storage, and speeding workflows without impacting original datasets.

  • Integrated AI

    Integrated AI

    Fabric includes embedded AI capabilities, allowing users to run predictive models and advanced analytics on data without moving it between services, accelerating insight generation.

  • Unified Permissions

    Unified Permissions

    Centralizes all access rights in OneLake, reducing redundant credential setups, simplifying security management, and ensuring consistent permission policies across workloads.

  • Cross-Platform Connectivity

    Cross-Platform Connectivity

    Fabric shortcuts and connectors enable seamless integration with Azure, AWS, and other platforms, facilitating multi-cloud analytics without complex data pipelines.

  • Data Governance

    Data Governance

    Built-in tools provide compliance monitoring, data lineage, and quality checks, ensuring organizations can meet regulatory requirements and maintain trustworthy datasets.

Benefits of Implementing Microsoft Fabric

Allston Yale’s Microsoft Fabric services empower enterprises to leverage advanced data capabilities with ease. Our services optimize your workflows, reduce infrastructure complexity, and deliver faster, actionable insights.

  • Streamlined Analytics

    A unified Microsoft Fabric environment removes the need for multiple disconnected tools, enabling teams to explore, analyze, and report on data faster, streamlining workflows, and increasing efficiency across your organization.

  • Centralized Data

    With OneLake storage, all enterprise data is centralized in a consistent location. This ensures secure access, easy collaboration across departments, and a single source of truth that simplifies data management and enhances operational efficiency.

  • Reduced Duplication

    Fabric shortcuts allow direct access to data without creating redundant copies. This reduces storage costs, minimizes unnecessary data duplication, improves workflow speed, and ensures that teams are always working with the most current version of each dataset.

  • Enhanced Security

    Centralized permission management in Microsoft Fabric reduces the risk of inconsistent access controls, simplifies credential oversight, and ensures that users only see data they are authorized for, enhancing overall organizational security and compliance.

  • Cross-Cloud Insights

    Microsoft Fabric integrates seamlessly with Azure, AWS, and other cloud platforms, enabling data analytics across multiple environments. This allows organizations to combine insights from different sources without complex ETL processes or fragmented workflows.

  • Improved Decision-Making

    Embedded AI models and governance features in Fabric provide predictive insights, quality checks, and compliance monitoring. This helps organizations make data-driven decisions confidently, anticipate trends, and maintain regulatory standards effectively.

What is Microsoft Fabric Shortcuts? Unlock Unified Data

Microsoft Fabric shortcuts allow organizations to centralize data access, cut redundant copies, and streamline analytics. Allston Yale’s services help you deploy these shortcuts effectively, improving efficiency and insight delivery. Book a consultation today to optimize your data environment.

Friday Fabric Facts #1: SQL Tools Just Got Smarter- Here's What It Means for Your Fabric Warehouse

Microsoft just announced major investments in SQL tooling for Fabric- but buried in the announcement is one capability that changes how SMB data teams should think about warehouse perforMicrosoft just announced major investments in SQL tooling for Fabric- but buried in the announcement is one capability that changes how SMB data teams should think about warehouse performance monitoring, security management, and migration planning.

If you're running SQL database in Fabric or thinking about migrating from Azure SQL or on-premises SQL Server, this 8-minute read will save you dozens of hours of troubleshooting next quarter and help you avoid the #1 mistake I see SMBs make when evaluating Fabric as their analytics platform.

What we'll cover:

  • Microsoft's strategic bet on SQL-first tooling (and what it signals about Fabric's roadmap)
  • The real business impact for $50M–$100M SMBs with lean IT teams
  • Three concrete moves you can execute Monday morning (with step-by-step instructions)
  • The architecture mistake that costs SMBs $15K–$40K in wasted capacity spend

📦 The Update: Microsoft's SQL Tools Investment (And Why It's a Big Deal)

What Microsoft Announced

The SQL tools and experiences team at Microsoft just committed to building "tools, SDKs, and experiences" focused on SQL Server, Azure SQL, and SQL database in Fabric.

This isn't just a feature announcement- it's a strategic signal. Microsoft is investing engineering resources to make Fabric's SQL layer feel native to the 10+ million SQL Server professionals worldwide who've spent decades mastering T-SQL, SSMS, and Azure Data Studio.

What's Actually New (The Technical Details)

1. Enhanced tooling for SQL database in Fabric

Fabric's SQL database (the warehouse layer that sits on top of OneLake) is getting first-class support in SQL Server Management Studio (SSMS) and Azure Data Studio.

What this means in practice:

  • Full IntelliSense support for T-SQL queries against Fabric warehouses (autocomplete for table names, column names, functions)
  • Visual query plan analysis so you can troubleshoot slow queries the same way you do in Azure SQL
  • Object Explorer integration to browse tables, views, and schemas without switching to the Fabric portal
  • Live query statistics to monitor in-flight queries (critical for identifying bottlenecks during peak hours)

Previously, many of these capabilities required switching between SSMS, Azure Data Studio, and the Fabric web portal- fragmenting the troubleshooting workflow.

2. Cross-product SDK improvements

Microsoft is unifying the developer experience across SQL Server, Azure SQL, and Fabric SQL database through shared SDKs (Software Development Kits).

For SMB data teams, this means:

  • Reusable connection libraries: If your custom app connects to Azure SQL using SqlClient, it can connect to Fabric SQL database with minimal code changes
  • Consistent authentication patterns: Azure AD (Entra ID) authentication works the same way across all three platforms
  • Unified monitoring APIs: Tools like Datadog, Grafana, or custom monitoring scripts can query performance metrics using the same API calls

3. Better integration between SSMS, Azure Data Studio, and Fabric workspaces

You'll be able to:

  • Launch Azure Data Studio directly from a Fabric workspace (one-click context switching)
  • Save connection profiles in SSMS that point to Fabric SQL databases (no more copying connection strings)
  • Use SSMS's "Generate Scripts" wizard to export schema definitions from Fabric warehouses

Why Microsoft Is Doing This Now

The strategic bet: Microsoft believes SQL professionals (DBAs, BI developers, data analysts) will become the primary users of Fabric warehouses- not just Spark engineers or data scientists.

The competitive context:

  • Snowflake and Databricks are marketing themselves as "SQL-friendly" platforms for analytics engineers
  • AWS Redshift has always been SQL-first
  • Microsoft needs Fabric to feel equally native to the 70%+ of data teams who write T-SQL daily, not PySpark notebooks

By investing in SQL tooling, Microsoft is saying: "You don't need to become a data engineer to use Fabric. Your existing SQL skills are enough."

💡 Why This Matters (The Business Impact for Your SMB)

The Core Promise of Fabric (For Context)

If you're an SMB running Power BI on top of Azure SQL, SQL Server, or even Excel today, Microsoft pitches Fabric as your "cloud-native upgrade path."

What you get with Fabric:

  • Unified analytics platform: Data lake (OneLake) + data warehouse (SQL database) + data pipelines + Power BI + real-time analytics- all in one subscription
  • No infrastructure management: Microsoft handles scaling, backups, high availability, disaster recovery
  • Integrated AI capabilities: Copilot for writing DAX/SQL, AI skills for predictions, semantic link for Python/R integration
  • Pay-per-use pricing: Capacity-based billing (you pay for compute/storage you use, not per-database or per-user)

The pitch to CFOs: Replace 4–6 separate tools (Azure SQL, Azure Data Factory, Power BI Premium, Azure Synapse) with one platform and one bill.

The Concern Most CTOs Have

Here's the question I hear in every Fabric diagnostic call:

"Will my SQL team be able to troubleshoot performance, manage security, and write queries the same way they do in Azure SQL or will they need to learn a completely new toolset?"

Why this matters:

  • Most $50M–$100M SMBs have 1–3 SQL-savvy people (a DBA, a BI developer, maybe a senior analyst)
  • These teams are already stretched thin managing existing reports, ETL jobs, and ad hoc requests
  • Retraining them on Spark notebooks, lakehouse architecture, and Python/Scala is a 6–12 month investment most SMBs can't afford
  • If the tooling is unfamiliar, adoption stalls and Fabric becomes "shelfware"

This tooling investment answers that concern. Microsoft is making Fabric's SQL layer feel like Azure SQL (familiar tooling, familiar workflows), not like a black-box lakehouse you can only query through notebooks.

Real-World Scenario: Healthcare Company Migration

Let me walk you through a real example (anonymized client details).

Company profile:

  • $60M revenue, multi-location healthcare services provider
  • IT team: 1 CTO, 2 SQL developers, 1 BI analyst
  • Current stack: SQL Server 2019 on-premises + 40+ SSRS reports + Power BI Pro licenses
  • Pain point: SSRS reports take 10–15 minutes to refresh; manual Excel exports for board meetings; no real-time dashboards

The migration goal: Move to Fabric to get real-time dashboards, reduce report refresh times, and eliminate manual Excel work- without retraining the SQL team on PySpark.

What the SQL tooling investment enables:

1. No forced rewrite of T-SQL logic

The team had 200+ stored procedures handling business logic (patient visit aggregations, provider productivity calculations, billing reconciliation).

With enhanced SSMS support for Fabric SQL database:

  • They can copy/paste stored procedures from SQL Server to Fabric (with minor syntax adjustments for unsupported features)
  • They can test procedures in SSMS using the same debugging workflow (step through code, inspect variables)
  • They can schedule execution via Fabric pipelines (not SQL Agent, but visually similar)

Result: 85% of stored procedures migrated in 3 weeks (vs. 4–6 months if they had to rewrite everything in Spark)

2. Familiar troubleshooting workflow

When a Power BI report runs slow, the BI analyst can:

  • Open SSMS
  • Connect to the Fabric SQL database
  • Run the same query Power BI is running
  • View the execution plan to identify missing indexes or scan-heavy operations
  • Fix the issue using standard T-SQL tuning techniques (add indexes, rewrite joins, partition tables)

Result: The team didn't need to learn Databricks notebooks, Spark UI, or lakehouse optimization—they used the same SSMS skills they've had for 10 years.

3. Security management stays SQL-based

The CTO needed to enforce row-level security (only show doctors their own patients, only show clinic managers their own clinic's data).

With SSMS integration:

Result: Security implementation took 2 days instead of 2 weeks (no need to learn Fabric's workspace roles + OneLake security + Power BI RLS separately)

Why This Matters for Food & Beverage and Energy SMBs

The same pattern applies to Isaac's other verticals:

Food & beverage ($50M–$100M):

  • Typical stack: SQL Server + Excel-based demand planning + manual inventory reports
  • SQL team strength: 1–2 people who know T-SQL and SSRS
  • Fabric value: Real-time inventory dashboards, automated demand forecasting, trade spend analytics- without retraining the SQL team on data engineering tools

Energy SMBs:

  • Typical stack: Historian databases (OSIsoft PI, Aveva) + SQL Server for reporting + Excel for field operations
  • SQL team strength: 1 BI developer + 1 DBA managing SQL Server
  • Fabric value: Integrate real-time sensor data (via Event Streams) with SQL-based reporting- using T-SQL for transformations instead of Spark

✅ The Move (What You Can Do Monday Morning)

Here are three concrete actions you can take this week to evaluate whether Fabric's SQL tooling fits your SMB's needs. Each takes 30–60 minutes.

Move #1: Test SSMS Connectivity to Fabric SQL Database (Free Tier Available)

Why do this: Prove to yourself (and your team) that SSMS works with Fabric the same way it works with Azure SQL. This removes the "unknown tooling" risk from your evaluation.

Step-by-step instructions:

1. Create a trial Fabric workspace (10 minutes)

  • Go tohttps://app.fabric.microsoft.com
  • Sign in with your work account (or create a free Microsoft account)
  • Click "Workspaces" → "New workspace" → Name it "Fabric SQL Test"
  • Select "Trial" capacity (gives you 60 days of free Fabric capacity—no credit card required)

2. Provision a SQL database in Fabric (5 minutes)

  • Inside your workspace, click "New" → "Warehouse"
  • Name it "TestWarehouse"
  • Wait 2–3 minutes for provisioning
  • Once created, click "Settings" → "SQL connection string" → Copy the connection string

3. Connect via SSMS (5 minutes)

  • Open SQL Server Management Studio (download latest version:https://aka.ms/ssmsfullsetup)
  • Click "Connect" → "Database Engine"
  • Paste the Fabric SQL connection string in the "Server name" field
  • Authentication: Select "Azure Active Directory - Universal with MFA"
  • Enter your work email
  • Click "Connect"

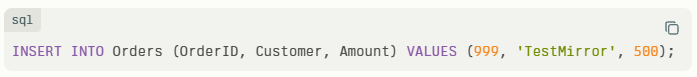
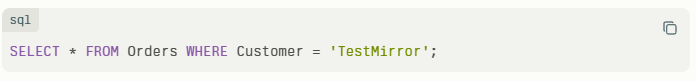
4. Run a test query (5 minutes)

  • Right-click your warehouse → "New Query"
  • Run:
  • Observe query execution time (should be <1 second for this toy example)
  • Right-click the query → "Display Estimated Execution Plan" (verify this works)

What to look for:

  • ✅ Does IntelliSense autocomplete table/column names?
  • ✅ Can you browse tables in Object Explorer?
  • ✅ Can you view execution plans?
  • ✅ Does the workflow feel like Azure SQL?

If yes to all four, your SQL team can work in Fabric using familiar tools.

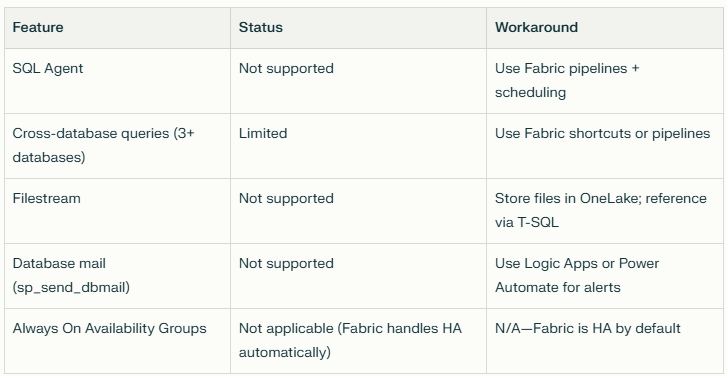
Move #2: Audit Your Current SQL Dependencies (Identify Migration Blockers)

Why do this: Not all SQL Server features are supported in Fabric SQL database. Knowing your blockers before migration prevents expensive surprises.

Step-by-step instructions:

1. List stored procedures, views, and scripts your team runs daily (15 minutes)

Run this query in your current SQL Server or Azure SQL database:

sql

-- Find all stored procedures SELECT SCHEMA_NAME(schema_id) AS SchemaName, name AS ObjectName, type_desc AS ObjectType, create_date, modify_date FROM sys.objects WHERE type IN ('P', 'V', 'FN', 'TF') -- Procedures, Views, Functions ORDER BY modify_date DESC;

Export the results to Excel. You now have an inventory.

2. Flag anything using SQL Server-specific features (20 minutes)

Search your stored procedure code for these keywords (common migration blockers as of Jan 2026)

Newsletter Issue 1 Image 01

How to search your code:


-- Find procedures using SQL Agent (xp_* procedures)

SELECT OBJECT_NAME(object_id), OBJECT_DEFINITION(object_id)

FROM sys.sql_modules

WHERE OBJECT_DEFINITION(object_id) LIKE '%xp_%'

   OR OBJECT_DEFINITION(object_id) LIKE '%sp_send_dbmail%';

-- Find procedures using linked servers

SELECT OBJECT_NAME(object_id), OBJECT_DEFINITION(object_id)

FROM sys.sql_modules

WHERE OBJECT_DEFINITION(object_id) LIKE '%OPENQUERY%'

   OR OBJECT_DEFINITION(object_id) LIKE '%linked_server%';


Export the results. These are your migration blockers.

3. Estimate rewrite effort (10 minutes)

For each blocker, estimate:

  • Low effort (1–2 hours): Replace SQL Agent job with Fabric pipeline
  • Medium effort (1–2 days): Rewrite cross-database query as pipeline + SQL
  • High effort (1–2 weeks): Rewrite CLR assembly logic in Python

Add up the hours. This is your migration tax.

Example from a real client:

  • 40 stored procedures scanned
  • 3 used SQL Agent (low effort: 6 hours to convert to pipelines)
  • 1 used linked servers (medium effort: 2 days to rewrite as data flow)
  • 0 used CLR (high effort: dodged a bullet)
  • Total migration tax: 2.5 days (vs. 4–6 weeks if they'd discovered this during migration)

Move #3: Ask Microsoft (or Your Partner) One Question

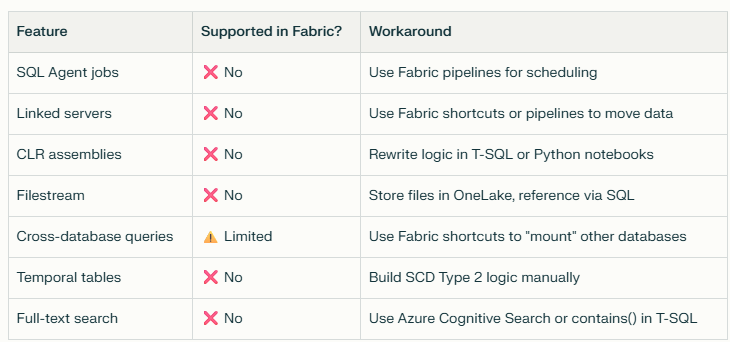
Why do this: Microsoft is actively investing in Fabric SQL tooling, which means the feature gap list changes every quarter. Knowing what's not supported today prevents scope creep.

The question to ask:


"Which SSMS features are NOT supported in Fabric SQL database as of January 2026, and what's on the roadmap for the next 6 months?"


Where to ask:

Example gaps as of Jan 2026:

Newsletter Issue 1 Image 02

Why this matters: This list changes fast as Microsoft invests. In Q4 2025, cross-database queries were completely unsupported. As of Jan 2026, they're "limited" (2-way joins work; 3-way joins don't). By Q2 2026, they might be fully supported.

Knowing the current state prevents you from designing around a limitation that won't exist in 6 months.

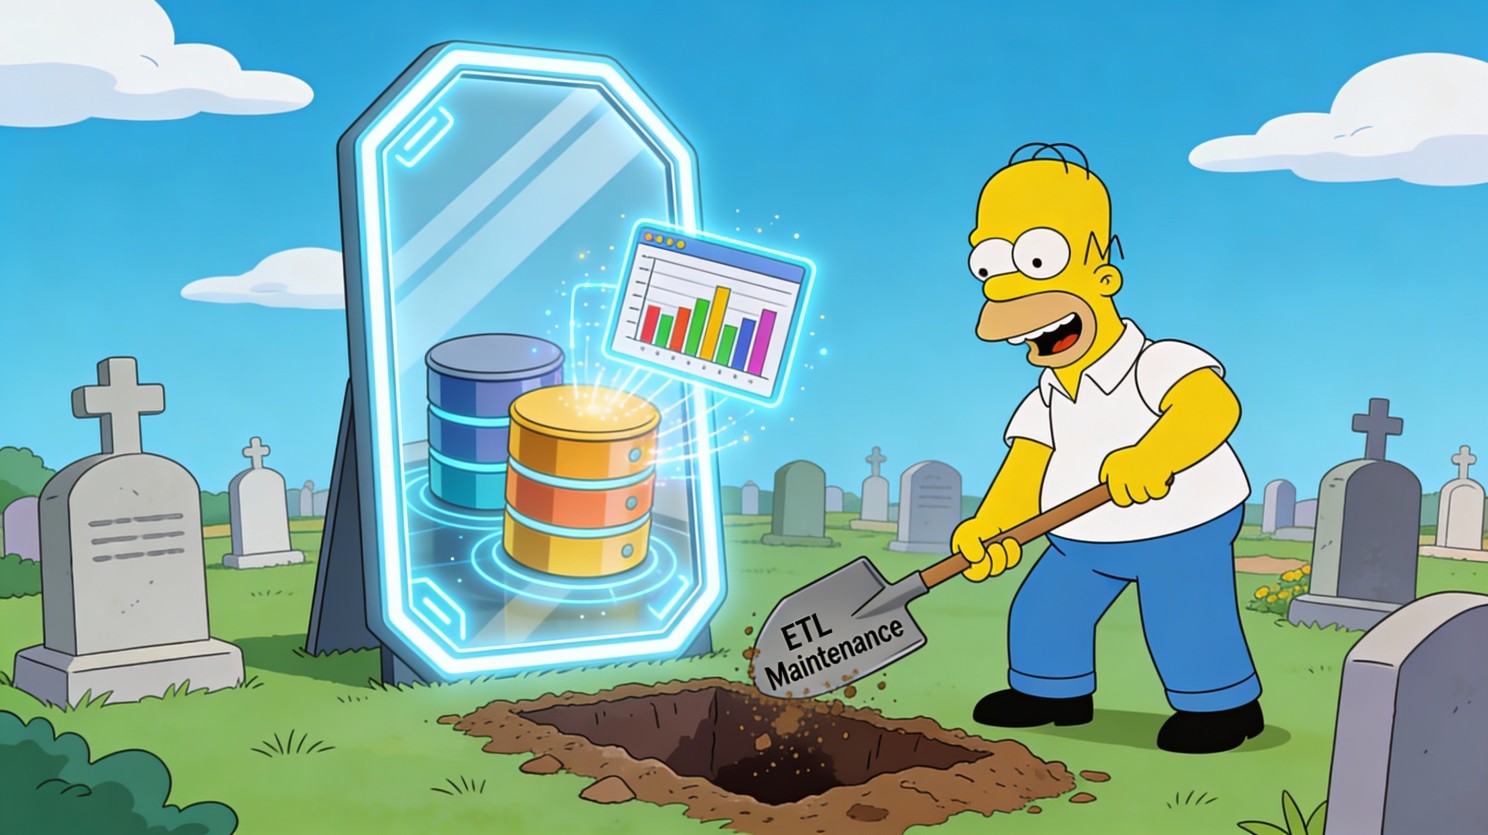
⚠️ The Gotcha (Common Mistake That Costs SMBs $15K–$40K)

The Mistake: "SQL database in Fabric" ≠ "Azure SQL in Fabric"

Here's the architecture misunderstanding I see most often:

What SMBs assume: "Fabric SQL database is just Azure SQL, but with OneLake integration and Power BI bundled in. I can replace my Azure SQL database with Fabric SQL database and get the same performance for transactional workloads—plus analytics on top."

What's actually true: Fabric SQL database is built on a different engine optimized for analytics (columnar storage, lakehouse integration), not transactional OLTP workloads.

Technical Deep-Dive: Why the Engine Matters

Azure SQL architecture:

  • Row-store engine: Data stored row-by-row (optimized for INSERT/UPDATE/DELETE operations)
  • Write-optimized: Handles thousands of concurrent writes per second
  • OLTP use case: Order entry systems, ERP databases, CRM systems

Fabric SQL database architecture:

  • Columnar storage: Data stored column-by-column (optimized for SELECT queries with aggregations)
  • Read-optimized: Handles complex analytical queries across billions of rows
  • OLAP use case: Data warehouses, reporting databases, Power BI DirectQuery sources

Translation for Non-Technical Leaders

✅ Fabric SQL database is great for:

  • Reporting queries (dashboards, Power BI, SSRS)
  • Aggregate calculations (SUM, AVG, COUNT across millions of rows)
  • Power BI DirectQuery (real-time dashboards without importing data)
  • Historical analysis (year-over-year trends, cohort analysis)

❌ Fabric SQL database is NOT ideal for:

  • High-frequency writes (order entry, IoT sensor data, clickstream logs)
  • Row-by-row updates (updating inventory counts 1,000x/minute)
  • Real-time transaction processing (OLTP workloads)
  • Applications that need sub-10ms write latency

Real Mistake I've Seen (And How Much It Cost)

Company profile:

  • $75M food distributor
  • Current stack: Azure SQL (operational database for order entry) + SQL Server (reporting database, refreshed nightly)
  • Pain point: Paying for two SQL databases ($800/month for Azure SQL + $400/month for SQL Server VM)

The decision: CTO saw Fabric's pricing ($0.18/hour for capacity) and thought: "If I move both databases to Fabric SQL, I'll pay $130/month instead of $1,200/month. That's $12K/year in savings."

What happened:

  • Week 1: Migrated reporting database to Fabric SQL → ✅ Success (queries ran 2x faster)
  • Week 2: Migrated operational database to Fabric SQL → ❌ Disaster
  • Week 3: During peak order entry hours (lunch rush, 11 AM–1 PM), write operations slowed to 5–10 seconds per INSERT
  • Customer service reps saw "saving order..." spinners for 10+ seconds
  • Orders backed up; phones rang off the hook
  • CTO rolled back to Azure SQL after 3 weeks

The cost:

  • 3 weeks of engineering time (80 hours @ $150/hour loaded cost = $12K)
  • Lost productivity (customer service reps idle during peak hours)
  • Reputational damage (customers complained about slow order system)

Total waste: $15K–$20K (more than the annual savings they were chasing)

The Right Architecture (Hybrid Approach)

What the company should have done:

Keep transactional workloads in Azure SQL:

  • Order entry system stays in Azure SQL (optimized for writes)
  • Customer service reps experience no slowdown
  • Cost: $800/month (unchanged)

Use Fabric SQL database as the analytics layer:

  • Load data from Azure SQL into Fabric SQL database via Fabric pipelines (ETL) or database mirroring (near-real-time replication)
  • Run all Power BI reports and dashboards against Fabric SQL database (read-optimized)
  • Cost: $130–$200/month for Fabric capacity (depending on query volume)

Total cost: $930–$1,000/month (still 17% savings vs. $1,200/month, with zero performance risk)

How to Know Which Workload Goes Where

Use this decision tree:

Question 1: Is this workload write-heavy or read-heavy?

  • Write-heavy (>100 INSERTs/UPDATEs per second) → Azure SQL or SQL Server
  • Read-heavy (mostly SELECT queries) → Fabric SQL database

Question 2: Do users need sub-second response times for writes?

  • Yes (e.g., order entry, POS systems) → Azure SQL
  • No (e.g., nightly batch loads, hourly ETL) → Fabric SQL database

Question 3: Is this data used for operational decisions or analytical decisions?

  • Operational (e.g., "Is this item in stock?") → Azure SQL
  • Analytical (e.g., "Which products had the highest return rate last quarter?") → Fabric SQL database

The Migration Pattern That Works

Step 1: Keep your operational database where it is (Azure SQL or SQL Server)

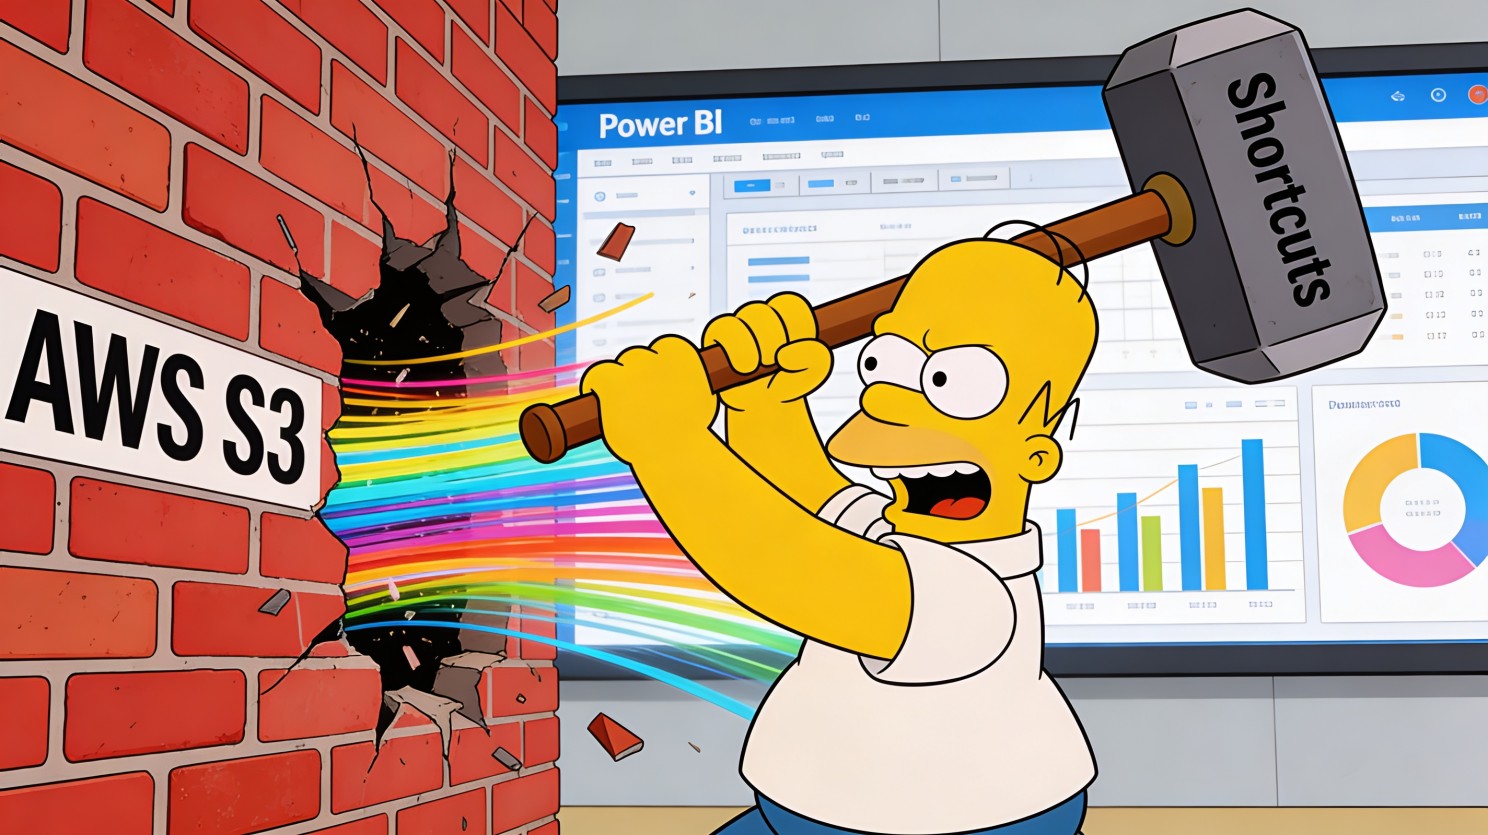
Step 2: Set up Fabric database mirroring (new feature as of Q4 2025)

  • Mirroring replicates data from Azure SQL to Fabric in near-real-time (5–15 minute lag)
  • No ETL code to write; Microsoft handles it automatically
  • Source database experiences minimal performance impact

Step 3: Point Power BI reports at Fabric SQL database

  • Reports query the mirrored data in Fabric (read-optimized)
  • Operational database is freed up for transactional workloads
  • Users see near-real-time data (5–15 minute freshness is fine for most dashboards)

Step 4: Decommission your old reporting database (if you had a separate one)

  • Fabric SQL database replaces your reporting database
  • You no longer pay for a second SQL Server VM or Azure SQL instance
  • This is where the cost savings come from (not from replacing operational databases)

🎓 Resource Library (Free Downloads for Subscribers)

This Week's Bonus: "The 5-Question Fabric Readiness Checklist"

Answer these 5 questions to know if your SMB is ready to migrate to Fabric (or if you need to solve foundational issues first):

1. Do you have a single source of truth for key metrics (revenue, margin, inventory)?

  • ✅ Yes → Proceed to Q2
  • ❌ No → Fix data governance first (Fabric won't magically align mismatched definitions)

2. Is your current SQL Server or Azure SQL database performance-bottlenecked?

  • ✅ Yes (slow reports, maxed-out DTUs) → Fabric will help
  • ❌ No (performance is fine) → Migration ROI is lower; focus on new analytics use cases instead

3. Do you have more than 3 separate tools in your analytics stack (ERP + reporting DB + Power BI + ETL tool + Excel)?

  • ✅ Yes → Fabric consolidation will save costs and simplify management
  • ❌ No (1–2 tools) → Consolidation ROI is lower

4. Does your team know T-SQL but NOT Python/Spark?

  • ✅ Yes → Fabric's SQL tooling investment makes you a great fit
  • ❌ No (team is already Spark-native) → Databricks might be a better fit

5. Are you spending >$1,500/month on Azure SQL + Power BI + ETL tools?

  • ✅ Yes → Fabric capacity pricing will likely save money
  • ❌ No (<$1,500/month) → Cost savings are marginal; migrate for features, not cost

Your score:

  • 4–5 "Yes" answers: High Fabric readiness—schedule a diagnostic call
  • 2–3 "Yes" answers: Medium readiness—pilot one use case first
  • 0–1 "Yes" answers: Low readiness—solve foundational data issues before migrating

💬 One Question for You

What's your #1 hesitation about moving from Azure SQL (or SQL Server) to Fabric?

Drop it in the comments or DM me:

A) "Performance under heavy query load"

B) "Migration cost and downtime"

C) "Team retraining on new tools"

D) "Vendor lock-in with Microsoft"

E) Something else (tell me)


Isaac Truong | Founder, Allston Yale

Enterprise-grade analytics for $50M–$100M SMBs

Power BI | Fabric | Azure | Data Strategy

📅 Book a 20-min Fabric diagnostic →

📧 Subscribe to get Friday Fabric Facts in your inbox (plus early access to templates) 💼

LinkedIn: Connect with me for daily Fabric tips

Friday Fabric Facts #1: Originally Posted on LinkedIn, January 31, 2026


Friday Fabric Facts #2: Fabric's New Mirroring Feature: Azure SQL → Lakehouse in 10 Minutes

For the last 15 years, if you wanted to report on data from your Azure SQL database, you had to build an ETL pipeline.

You paid for Azure Data Factory, you wrote code to handle incremental refreshes, and you woke up at 3 AM when the pipeline failed.

Microsoft just killed that requirement.

With Fabric Database Mirroring, you can replicate your Azure SQL data to OneLake in near-real-time, without writing a single line of ETL code.

If you're paying for Azure Data Factory or struggling with stale data in Power BI, this 4-minute read could save you $500/month and 10 hours of maintenance.

Newsletter Issue 2 Image 01

📦 The Update: Zero-ETL Mirroring is Here

Microsoft has rolled outDatabase Mirroringfor Azure SQL Database, Snowflake, and Cosmos DB.

What it does:It continuously replicates data from your operational database (Azure SQL) to Fabric's OneLake in near-real-time.

  • No ETL code:It's a "click-to-configure" experience.
  • No performance hit:It uses Change Data Capture (CDC) technology to read transaction logs, so it doesn't slow down your source database.
  • Analytics-ready:Data lands in OneLake as Delta Parquet files, ready for Power BI Direct Lake mode (blazing fast reporting).

The technical shift:You no longer need to "move" data to report on it. You just "mirror" it.

💡 Why This Matters (The Business Impact)

For a $50M–$100M SMB, the "ETL tax" is real.

  • Cost tax:You pay for ADF pipelines or Fivetran credits ($500–$2,000/month).
  • Time tax:Your BI developer spends 5 hours/week fixing broken pipelines instead of building dashboards.
  • Latency tax:Reports are always "as of last night" because you only run ETL once a day.

Real-world scenario for Isaac's SMB audience:A mid-sized logistics company ($80M revenue) has an Order Management System in Azure SQL.

  • Before Mirroring:Sales reps wait until 8 AM the next day to see yesterday's bookings.
  • With Mirroring:Sales dashboards update 5–15 minutes after an order is booked.
  • The Savings:They shut down 12 Azure Data Factory pipelines, saving $600/month and freeing up the Data Engineer to work on predictive analytics.

✅ The Move (What You Can Do Monday)

You can set this up in 10 minutes. Here's how to pilot it withone tableto prove the value.

1. Enable System Assigned Managed Identity (SAMI) on your Azure SQL Server

  • Go to Azure Portal → SQL Server → Identity
  • Set "System assigned" toOn.
  • Why:Fabric uses this identity to securely read data without storing passwords.

2. Create a Mirrored Database in Fabric

  • Open Fabric → "Data Warehouse" persona → "Mirrored Azure SQL Database"
  • Click "New" → Select your Azure SQL subscription.
  • Crucial Step:Select "Mirror all data" by default, OR uncheck it to select specific tables (recommended for the pilot).

3. Watch the Magic (Test It)

  • Insert a dummy row into your Azure SQL table

Newsletter Issue 2 Image 02

  • Wait 2–5 minutes.
  • Query the mirrored table in Fabric (SQL Analytics Endpoint)

Newsletter Issue 2 Image 03

  • If the row appears, you just built a real-time pipeline with zero code

Newsletter Issue 2 Image 04


⚠️ The Gotcha (Common Limitations to Watch For)

Mirroring is magic, but it has rules. If you ignore these, your mirror will🪞

1. Unsupported Features (The "Blockers")Your tablecannotbe mirrored if it uses:

  • Temporal Tables(system-versioned history)
  • Always Encryptedcolumns
  • In-Memory OLTPtables
  • JSON or XML data types(older specialized types)

2. The Primary Key RuleEvery table you want to mirrormust have a Primary Key. No PK = No Mirror.

3. Network SecurityIf your Azure SQL Server has a firewall rule blocking "Azure Services," Fabric can't connect. You must "Allow Azure services and resources to access this server" or configure a private endpoint (more complex).

Real mistake I've seen:A CFO wanted real-time financial reporting. We set up mirroring, but the GeneralLedger table usedTemporal Tablesfor audit trails. The mirror failed silently for that table.

The Fix:We created a standard view that selected from the current temporal table and mirrored theview? No, you can't mirror views directly. We had to create a secondary standard table populated by a trigger (messy) or stick to standard ETL for that specific table.Know your source schema before you promise real-time data.

💬 One Question for You

How much do you spend monthly on Azure Data Factory (or Fivetran) just to move data from Point A to Point B?

Drop a number in the comments (e.g., "$500", "$2k"). I'm betting Mirroring can cut that by 50%Stop paying to move data.

🛑 Stop paying to move data.

🟢 Start paying to use it.

Newsletter Issue 2 Image 05


Isaac Truong | Founder, Allston Yale

Enterprise-grade analytics for $50M–$100M SMBs

Power BI | Fabric | Azure | Data Strategy

📅 Book a 20-min Fabric diagnostic →

📧 Subscribe to get Friday Fabric Facts in your inbox (plus early access to templates) 💼

LinkedIn: Connect with me for daily Fabric tips


Friday Fabric Facts #2: Originally Posted on LinkedIn, February 6, 2026


Friday Fabric Facts #3: Stop Paying the 'ETL Tax': The Case for Zero-Copy Analytics in 2026

For the last decade, the data industry sold us a very expensive lie:"To analyze your data, you must first centralize it."

We accepted "Data Gravity" as a law of physics.

We built massive ETL pipelines.

We paid millions in egress fees.

We waited 24 hours for "daily loads" to complete.

And we accepted that 40% of our engineering budget would be spent just moving bytes from Point A (AWS S3) to Point B (Our Warehouse) before a single decision could be made.

That era is over. The new law of physics is Data Virtualization.

Microsoft Fabric’sOneLake Shortcutsarchitecture represents a fundamental shift in how we think about data sovereignty.

It validates a thesis I have held for years:The value of data is defined by its accessibility, not its location.

Today, I’m unpacking why the "Centralize Everything" strategy is failing modern SMBs, and why the future belongs to architectures that leave data where it lands.

The Professional Reality: The "Shadow Data" Crisis

In my work advising CIOs at $50M–$100M organizations, I see the same pattern repeatedly.

Let’s call it the"Logistics Paradox."

I recently audited the architecture of a mid-market logistics firm ($90M ARR).

Their core operational ERP lived in Azure SQL.

But their most valuable competitive asset, 5 years of telemetry data from their fleet sensors, sat dormant in AWS S3 buckets.

Why?

Because their data strategy was built on the "Centralize Everything" dogma.

To bring that S3 data into their Azure analytics environment required:

  1. Massive Engineering Lift:Building robust pipelines to move 40TB of history.
  2. Prohibitive Cost:AWS egress fees + Azure storage duplication fees.
  3. Latency:A 24-hour delay that rendered "real-time route optimization" impossible.

The result? The data stayed in S3.

The "Shadow Data" remained dark.

The insights, which could have saved them 15% in fuel costs, were lost.

This isn't a tooling problem.

It is a strategy problem.

They were trying to solve a 2026 problem with a 2015 playbook.

Newsletter Issue 3 Image 01

The Strategic Shift: Virtualization Over Replication

Microsoft Fabric’sOneLake Shortcutsvalidates a different approach.

It acknowledges that multi-cloud is not a temporary inconvenience, it is the permanent state of modern enterprise.

By allowing us to "mount" external storage (AWS S3, Google Cloud, ADLS Gen2) directly into the compute environment without moving the physical files, we change the economic equation of analytics.

This is not just a feature update. It is an architectural philosophy:

  • Decouple Compute from Storage:Run your high-performance Power BI compute engines in Azure while your raw assets remain in cheap AWS S3 cold storage.
  • Eliminate the "ETL Tax":Stop paying engineers to build plumbing. Start paying them to build models.
  • Federated Governance:Apply a single security model (Fabric) over distributed assets.

In the case of that logistics firm, the solution wasn't a better pipeline. It wasvirtualization.

We used Shortcuts to mount the S3 buckets.

The data never moved.

The cost of duplication was zero.

But suddenly, Power BI could see 5 years of history as if it were local.

The outcome wasn't just "faster reports."

It was business agility.

They launched their route optimization model in 3 weeks, not 6 months.

Strategy is useless without execution.

Here is how we connect S3 data to Fabric in 5 minutes, proving that cross-cloud analytics is now a configuration task, not an engineering project.

1. Get your AWS Credentials ready

  • Log into AWS IAM.
  • Create a user with s3:GetObject and s3:ListBucket permissions.
  • Copy theAccess Key IDandSecret Access Key.

2. Create the Shortcut in Fabric

  • Open your Fabric Lakehouse.
  • Right-click on"Files"or"Tables"→ Select"New shortcut".
  • Select"Amazon S3"from the list.
  • Enter your bucket path (s3://my-bucket-name) and paste your credentials.

3. Query it immediately

  • The S3 folder now appears in your Lakehouse explorer as if it were a local folder.
  • Right-click a CSV or Parquet file in that folder →"Load to Table".
  • Open a SQL Endpoint and write: SELECT TOP 100 * FROM MyS3ShortcutTable.
  • Boom. Cross-cloud analytics.

Newsletter Issue 3 Image 02

The "Gotcha" That No One Discusses

However, strategy requires nuance.

The danger of virtualization is that it makes cross-cloud querying feeltooeasy.

I often see teams confuseaccessibilitywithperformance.

Just because youcanquery a JSON file in S3 directly doesn't mean youshoulduse it for a CEO's dashboard.

My Thinking Framework:When designing these architectures, I classify data into two strategic tiers:

  1. "Cold" / Exploratory Data:Leave it where it is (S3). Use Virtualization (Shortcuts). This is for data scientists and ad-hoc analysis where latency is acceptable but agility is paramount.
  2. "Hot" / Decision Data:If this data powers a daily KPI dashboard for the C-Suite, virtualization is the ingestion method, not the serving layer. We use the Shortcut toloadthe data into a cache or Delta table for sub-second performance.

True expertise is knowing when to break the rule.

Virtualization is the bridge, not always the destination.

A Note to My Partners & Peers

The shift to Fabric and Data Virtualization opens a new era for us as technology leaders.

We are no longer "pipeline builders."

We areDecision Architects.

The value we bring to our clients, whether you are an internal leader or a consulting partner, is no longer in how efficiently we can move data. It is in how effectively we cancurateit.

If you are a Microsoft Partner, an MSP, or a Digital Agency struggling to articulate this shift to your clients, or if you need a specialized architect to design the data foundation for your digital transformation projects, this is where I operate.

My team and I focus on the strategic layer of Data & AI readiness. I don't just build reports; I design the decision engines that power modern SMBs.

Let’s elevate the conversation.

Newsletter Issue 3 Image 03


Isaac Truong | Founder, Allston Yale

Enterprise-grade analytics for $50M–$100M SMBs

Power BI | Fabric | Azure | Data Strategy

📅 Book a 20-min Fabric diagnostic →

📧 Subscribe to get Friday Fabric Facts in your inbox (plus early access to templates) 💼

LinkedIn: Connect with me for daily Fabric tips


Friday Fabric Facts #3: Originally Posted on LinkedIn, February 13, 2026


Friday Fabric Facts #4: The "Infinite Capacity" Trap: Why Your Fabric Bill Might Explode (And How to Smooth It Out)

In the cloud era, we traded "provisioning servers" for "provisioning capacity." The promise was simple: Pay for what you use, scale when you need it.

But with Microsoft Fabric, the economic model has shifted again, and most leaders haven't adjusted their strategy. We moved frompaying for storage(the data lake era) topaying for compute intensity(the Fabric era).

The danger?The "Infinite Capacity" Trap.

Fabric allows your workloads to "burst" beyond your purchased capacity to handle spikes. This feels like magic- until the bill arrives, or worse, until your entire tenant gets throttled because you borrowed too much from the future.

If you are treating Fabric capacity like a static server (buy it and forget it), you are already losing money.Capacity is now a financial instrument.You need to manage "smoothing" and "throttling" the same way a CFO manages cash flow.

Today, I’m breaking down the economics of Fabric capacity and why "smoothing" is the most misunderstood competitive advantage for SMBs.

The Professional Reality: The "Monday Morning Crash"

I recently advised a FinTech scale-up ($80M ARR) that migrated from Power BI Premium to a Fabric F64 capacity.

Their team loved the speed. They scheduled every heavy ETL job, every model refresh, and every data warehouse load to run at 8:00 AM Monday morning, right before the executive meeting.

For three weeks, it was perfect. Then, on Week 4,everything froze.

Reports didn't load. Pipelines failed. The CTO got an alert:"Capacity Throttled."

The Root Cause:They hadn't run out of money. They had run out of"Smoothing Credits."By stacking every job at 8:00 AM, they spiked their usage to 400% of their F64 limit. Fabric's "Bursting" feature allowed this... for a while. It smoothed that spike over 24 hours. But eventually, the debt came due. They had borrowed so much compute from the future that Microsoft locked the doors until the debt was paid.

They didn't need a bigger server (an F128 would cost $30k more/year).They needed a better schedule.

This is the new reality:Architecture is no longer just about code. It’s about timing.

The Strategic Shift: Managing "Compute Debt"

Microsoft Fabric introduces a concept called"Smoothing."Instead of capping you instantly when you hit 100% usage, Fabric averages your consumption over a rolling 24-hour window.

Think of it like a credit card:

  • You can spend $10,000 today (Bursting), even if your daily limit is $1,000.
  • BUT, you have to pay it back over the next few days.
  • If you keep spending, your card gets declined (Throttling).

The Strategy for SMBs:Stop building for "Peak Load." Build for "Average Load."

In the old world (SQL Server), you had to buy a server big enough for your busiest hour. If you needed 64 cores for 1 hour a day, you paid for 64 cores for 24 hours. Wasteful.

In the Fabric world, you can buy a smaller capacity (F32) and let "Smoothing" handle the 8:00 AM spike,IFyou ensure the rest of the day is quiet enough to pay back the debt.

This is the arbitrage opportunity:Smart architects can run massive enterprise workloads on SMB-sized capacities by optimizing fortime, not justperformance.

✅ The Move (Proof of Execution)

Strategy is useless without visibility. You cannot manage what you do not measure. Here is how we took control of that FinTech's capacity in 48 hours.

1. Install the "Fabric Capacity Metrics App" (The CFO’s Dashboard)

  • This isn't just a technical log; it's your balance sheet.
  • We installed the app and looked at the"Timepoint"

2. Identify the "Whales"

  • We filtered by Background % vs Interactive %.
  • We foundone specific Gen2 Dataflowthat was consuming 60% of their daily credit in 30 minutes. It was doing a full load of a 50GB table instead of an incremental refresh.

3. Flatten the Curve (The Fix)

  • Action:We shifted that massive Dataflow to run at 3:00 AM (the "valley" of usage).
  • Action:We enabled "Incremental Refresh" so it only processed new rows.
  • Result:The 8:00 AM spike dropped by 70%. Their "Smoothing Debt" vanished. They stayed on the F64 capacity instead of upgrading,saving $30,000/year.

 Newsletter Issue 4 Image 01


The "Gotcha" That No One Discusses

Here is the trap:Interactive Bursting works differently.

Fabric treatsUser Actions(clicking a report) differently thanBackground Jobs(ETL pipeline).

  • Background Jobsare smoothed over 24 hours.
  • Interactive Actionsare smoothed over just5 minutes.

Why this matters:You can overload your capacity with background ETL jobs, and your users won't feel it immediately. But if 500 users log in at once and hit a complex dashboard? That spike hitsnow.

My Thinking Framework:Always leave a "Headroom Buffer" for interactive users. If your background ETL is consistently eating 90% of your capacity, your CEO's dashboardwillbe slow, regardless of smoothing.

True expertise is preserving the user experience.We protect the "Interactive" lane at all costs.

A Note to My Partners & Peers

As we move deeper into the Fabric era, our role as partners is shifting fromTechnical ImplementationtoEconomic Optimization.

Clients don't just want us to build pipelines. They want us tomanage their cloud unit economics.

If you are a Microsoft Partner, MSP, or IT Leader struggling to predict or control your Fabric spend, this is where I operate. I help organizations design architectures that are not just technically sound, but financially optimized.

We don't just solve "Will it run?" We solve "Should we pay for it?"

Let’s elevate the conversation.


Isaac Truong | Founder, Allston Yale

Enterprise-grade analytics for $50M–$100M SMBs

Power BI | Fabric | Azure | Data Strategy

📅 Book a 20-min Fabric diagnostic →

📧 Subscribe to get Friday Fabric Facts in your inbox (plus early access to templates) 💼

LinkedIn: Connect with me for daily Fabric tips


Friday Fabric Facts #4: Originally Posted on LinkedIn, February 20, 2026


Friday Fabric Facts #5: Copilot Is Not Your Analyst: Why Fabric Needs Real Models Before It Deserves Your Questions

The industry pitch for Copilot in Fabric sounds seductive:"Ask questions in plain English. Get instant insights from your data."

What leaders hear is:“We finally don’t need to wait on analysts.”What actually happens is: users ask simple questions, Copilot responds with“I can’t do that”or, worse, gives an answer that looks right but isn’t.

The problem isn’t that Copilot is “bad AI.” The problem is that most organizations are asking anLLM to compensate for poor modeling and governance.

Copilot in Fabric is not a replacement for a semantic model. It is an amplifier of whatever semantic discipline you already have or don’t.

What Copilot Really Is (and What It Isn’t)

If you strip away the hype, Copilot in Fabric is two things:

  • Anatural language interfaceon top of your existing data models, reports, and warehouses.
  • Anassistantthat can generate DAX, SQL, visuals, and explanations grounded only in what it is allowed to see.

But there are hard constraints that most people discover the painful way:

  • Itcannot invent logicyou never modeled. If you never defined month‑over‑month growth as a measure, Copilot will not build a robust one just because you type “growth vs last month.”
  • Itcannot reconcile across reports. If sales lives in one dataset and marketing in another, Copilot can’t magically “join” them because they look related to you. It only works inside the current semantic model.
  • Itwill not guess missing numbers. Guardrails are deliberately strict; it prefers “I can’t answer” over hallucinating financials.

In other words, Copilot is not an analyst who understands your business and can improvise. It is areflection of your modeling discipline.

If your semantic layer is chaotic, Copilot is just a polite mirror of that chaos.

A Real Pattern: The “Why Can’t It Answer This Simple Question?” Moment

I see the same story play out in mid‑market organizations testing Copilot in Power BI and Fabric:

  1. The COE or BI team turns on Copilot for a pilot group.
  2. Business users open a report and ask things like:
  3. Copilot responds with some version of:

From the user’s perspective, Copilot failed a “basic” test. From the system’s perspective, the model never defined what “growth” means, what a “region” is, or which date to use.

The AI is not confused.The business is underspecified.

The Strategic Shift: Copilot as a Trust Test, Not a Shortcut

There is a subtle but powerful mindset shift I encourage leaders to make:

Instead of asking,“Why can’t Copilot figure this out?”ask,“What does this failure tell us about our modeling maturity?”

Because Copilot’s limitations are, in many ways, features:

  • It refuses to calculate with measures that don’t exist. That forces you to formalize your logic instead of letting every ad‑hoc query redefine “margin” or “churn.”
  • It refuses to join across unrelated models. That highlights the fact that your organization never agreed on a single, shared semantic view of customers, products, or time.
  • It respects access boundaries and can be constrained to only “approved for Copilot” models, which draw a line betweenofficial truthandexperiment.

In that sense, Copilot is not just an assistant. It’s astress testfor whether your data estate is ready for AI‑driven decision support at all.

If Copilot struggles, your future AI initiatives will too- regardless of which vendor you choose.

Where Fabric Is Actually Going: From Prompts to Intelligence

Ignite 2025 made something very clear: Microsoft doesn’t see Fabric as just a place to store data anymore. It’s positioning it as theintelligence layerof the business.freschesolutions+1

Two shifts matter here:

  • Fabric Data Agents: These are no longer simple chatbots. They are designed to reason over warehouses, lakehouses, and semantic models; execute multi‑step tasks; and operate like analytical teammates rather than answer bots.
  • Fabric IQ: A semantic intelligence layer where you define business entities (customers, products, locations), relationships, and KPIs as first‑class concepts. Agents and Copilot then reason overthat, not over raw tables.

The message is clear:AI in Fabric will only be as smart as your semantics.

For SMBs, this is actually hopeful- not discouraging.

You don’t need a dozen data scientists to be “AI‑ready.” You need:

  • A clear, maintained semantic model of how your business operates.
  • Governance that separatestrusteddata products from experimental
  • Partners who understand that AI is amodeling and governance problem first, and a prompt problem second.

The Governance Blind Spot: AI Can Amplify Leaks Too

There is another uncomfortable truth: Copilot and agents don’t just amplify insight; they can amplifyexposureif governance is loose.

Community and Microsoft security guidance are already calling out scenarios where:gocollectiv+2

  • Users with access to a narrow report can, via Copilot, query the full underlying semantic model (including fields never shown in visuals) if boundaries aren’t configured carefully.
  • Semantic models are marked “approved for Copilot” by enthusiastic owners, without any central review, effectively bypassing data product endorsement processes.
  • AI can surface salary, forecast, or sensitive operational data to audiences who were never meant to see it, simply because no one tightened role‑based access before enabling

Again, these are not “AI problems.” They’redata product and governance problemsthat AI simply exposes faster.

The organizations that win with Fabric AI won’t be the ones that turn features on first. They’ll be the ones who are willing to ask,“Are we ready for these answers to be this easy to get?”

Hope for Lean Teams: You Don’t Need “AI Everything” to Start Winning

If you’re running a lean SMB data team, this might sound like one more impossible bar to clear. It isn’t.

You don’t need to “AI‑enable” the entire business in one shot. You need to be deliberate:

  • Pickone domain(e.g., revenue analytics, operations, or inventory) where definitions are stable and stakeholders are aligned.
  • Make that semantic modelairtight- clear metrics, clean relationships, row‑level security that you would be comfortable explaining to an auditor.
  • Mark only that model as “ready for Copilot,” and treat everything else as off‑limits until it matures.

In that environment, Copilot stops being a gimmick and becomes a force multiplier. AI isn’t guessing anymore; it’s amplifying a well‑defined understanding of your business.

For lean teams, that focused, high‑trust island is often enough to create outsized impact and enough proof to justify further investment.

Where I Fit In (For Partners and Leaders)

Most of the conversation around Fabric AI right now is stuck at two levels:

  • Themarketing level: “Ask your data anything with Copilot.”
  • Thefeature level: “Here’s how to turn it on in tenant settings.”

I don’t work at those levels.

I work with:

  • Microsoft and analytics partnerswho are expected to “bring an AI story” into Fabric projects but don’t want to own the semantic and governance risk alone.
  • CIOs, CDOs, and CTOswho are under pressure to “do something with AI” but quietly suspect that flipping Copilot on across the tenant will just magnify their modeling debt.
  • Operators in regulated or high‑stakes environments(healthcare, energy, finance) who can’t afford AI that improvises around incomplete governance.

My work lives at the intersection ofData Architecture, Semantics, and AI Readiness:

  • Making sure your AI experiences only sit ontrusted, intentional models.
  • Designinggovernance boundariesso Copilot and agents can be powerfulwithoutbecoming new leak vectors.
  • Helping partners position AI in Fabric not as a demo, but as a sustainable capability that clients can grow into.

If you’re building on Fabric and want AI that your leadership can actually trust- not just click‑throughs in a keynote- this is where partnership makes sense.

Isaac Truong| Founder, Allston Yale Strategic Data Architecture & AI Readiness for the Enterprise Mid‑Market

I don’t just turn Copilot on. I help you decidewhere it belongs, what it should see, and what it’s allowed to say- so AI becomes an asset, not another source of noise.

If you’re a partner or leader trying to align Fabric, AI, and governance into something coherent,let’s talk.


Isaac Truong | Founder, Allston Yale

Enterprise-grade analytics for $50M–$100M SMBs

Power BI | Fabric | Azure | Data Strategy

📅 Book a 20-min Fabric diagnostic →

📧 Subscribe to get Friday Fabric Facts in your inbox (plus early access to templates) 💼

LinkedIn: Connect with me for daily Fabric tips


Friday Fabric Facts #5: Originally Posted on LinkedIn, February 27, 2026


Friday Fabric Facts #6: Your Real Data Product Isn’t the Report- It’s the Semantic Model

The Executive Insight

Most organizations still talk about “reports” and “dashboards” as if they are the product.

In Fabric, that mindset is already out of date.

The real product-- the thing that determines whether AI, Copilot, and self‑service analytics actually help or quietly damage trust, is thesemantic model: the shared layer where you decide what a customer is, how revenue is calculated, which time logic is “official,” and who is allowed to see what.

Fabric didn’t invent semantic models, but it did something more dangerous: it made themcentral and easy to multiply. If you don’t have a strategy, you won’t end up with “more insight.” You’ll end up with three, five, or ten slightly different truths, now accelerated by AI and shared faster than ever.

Issue #6 is about that layer: not how to click through and build one more model, but how tothinkabout semantic models as the core of your data product strategy in Fabric.

The Quiet Problem: Too Many “Versions of the Truth” Wearing Different Clothes

In mid‑market companies, I keep bumping into the same pattern when Fabric enters the picture:

  • A lakehouse or warehouse is created.
  • Fabric generates adefault semantic model.
  • A team builds a “quick” report on top of it.
  • Another team copies the model, tweaks it a bit, and publishes their own.
  • A third team builds a brand‑new model on the same tables because “it’s faster than understanding the old one.”

Within a year, you have:

  • 4–5 models all claiming to represent “Sales,” each with different grain, measures, and security.
  • Power BI reports wired to each of them.
  • Copilot and agents now sitting on top of this mess, trying to answer questions across inconsistent semantics.

The metrics look similar. The numbers are close. The definitions are not.

From a distance, it looks like progress. Up close, you start to see the cracks: executive meetings where Sales and Finance bring two dashboards to the table and both are “right according to their model.”

Fabric didn’t cause that. It just made itmuch easierto get there.

Fabric’s Design Choice: More Power, More Choice, More Responsibility

Microsoft’s own guidance is clear: in Fabric, the semantic model is not an afterthought. It is thecentral contractbetween data and the rest of the business.msfabric+2

Several signals point in the same direction:

  • Guidance now recommendsunified, shareable semantic modelsover one‑off report models.
  • Default semantic models are being decoupled from their source items and treated as first‑class, independent assets.
  • Semantics are being wired directly intoFabric IQand data agents to give AI a stable ontology to reason over.

This is good news if you’re willing to treat semantic modeling as design, not plumbing.

It means:

  • One model can serve dozens of reports, teams, and tools.msfabric+1
  • AI can anchor itself in well‑defined entities and KPIs, not raw tables.refactored+1
  • Governance can operate at the model level instead of chasing down every individual report.

But it also means this:every undisciplined model you allow into production is a new fork of reality.

A Pattern From the Field: When “Default” Becomes “De Facto”

One concrete pattern I see a lot in Fabric pilots:

  • A lakehouse or warehouse is created.
  • Someone uses thedefault semantic modelbecause “it’s already there.”
  • They drag some fields, create a couple of measures, and build what becomes the most‑used report in the company.

Months later, problems appear:

  • The model started as a convenience layer, not a carefully designed star schema. It has awkward relationships, many‑to‑many joins, and performance issues.
  • Security was “good enough for now,” then quietly became the de facto security model for sensitive data.
  • Other analysts started building on top of it because it was the easiest thing to connect to.

Now you’re stuck:

  • You can’t change the model without breaking downstream reports.
  • You can’t easily replace it because 30+ artifacts are wired into it.
  • You can’t certify it with a straight face because you know it wasn’t designed to be the enterprise standard.

What started as the default silently became thestandard.

The hard truth: you don’t get to avoid semantic design. You only get to choose whether you do itintentionally up front, orpainfully later under load.

The Strategic Shift: Think “Platform Model,” Not “Report Model”

If you want Fabric to be more than a slightly better reporting engine, you have to start thinking in terms ofplatform models:

  • Models that are designed to besharedvia Build permissions, not owned by one report developer.
  • Models that arecertifiedand discoverable as the “official version” for a domain.msfabric+1
  • Models that are understood byhumans, not just engines--clear naming, clear grain, clear role‑level security.

Some of the most forward‑thinking teams I work with have adopted a simple philosophy:

“If a semantic model isn’t good enough to be shared, it isn’t good enough to exist in production.”

That doesn’t mean every experiment has to go through a committee. It means there’s a clear line:

  • Sandboxes where analysts can explore, prototype, and throw things away.
  • Platform models that are curated, governed, and intentionally reused.

Fabric’s feature set (DirectLake, shared models, Fabric IQ) strongly encourages that separation.refactored+2 Ignoring it doesn’t just cost performance; it erodes trust.

What This Means for AI, Again

In Issue #5, we talked about Copilot not being your analyst, but your mirror. The semantic model isthe mirror frame.

Copilot, data agents, and Fabric IQ don’t “understand” your business in the abstract. They understand:

  • The entities, relationships, and measures you’ve exposed through semantic models.
  • The permissions and domains laid out by your governance setup.enterprise-knowledge+2

If those models are:

  • duplicated,
  • inconsistent,
  • or lacking in basic clarity,

then AI will behave the same way--duplicated, inconsistent, and unclear.

The promise of Fabric IQ, a semantic intelligence layer over your business--only holds if you feed it a coherent ontology.

That work is not glamorous. It’s also exactly where long‑term advantage comes from.

Hope for Lean Teams: You Don’t Need a Perfect Enterprise Model

This can sound intimidating for lean SMB teams who are already stretched thin. The good news is you don’t need a perfect global enterprise model to start winning.

You needone well‑designed domain modelthat proves the point.

The patterns I see working well in $50M–$100M organizations look like this:

  • Choose a critical domain, oftenRevenue,Operations, orInventory-- where misalignment is currently expensive.
  • Invest in asingle, high‑quality semantic modelfor that domain: star schema, clear measures, row‑level security you’re proud of.
  • Make that model theonly certified sourcefor that topic. Everything else is clearly labeled as exploratory or legacy.
  • Wire Copilot, agents, and self‑service reporting only to that model at first.

What happens?

  • Executives start to notice that “the numbers finally match.”
  • Analysts spend less time arguing about data shape and more time asking better questions.
  • AI outputs stop feeling like a parlor trick and start feeling like an accelerant on a known truth.

At that point, expanding to a second and third domain stops being a theoretical debate. You have proof.

Where I Fit In (For Partners and Leaders)

Most Fabric conversations I see are still dominated by:

  • “Which workload should we put in a lakehouse vs warehouse?”
  • “Should we use Mirroring, Shortcuts, or Pipelines for this source?”
  • “How do we turn on Copilot for our tenant?”

Those are important, but they’renot enough.

Without a semantic strategy, every other decision is just rearranging the same confusion in new tools.

I work with:

  • Partnerswho need a semantic and governance backbone for their Fabric projects, so they’re not shipping beautiful reports on top of unstable definitions.
  • CIOs, CDOs, and CTOswho want “single version of the truth” to be more than a slide in a board deck.
  • Business leaders in F&B, healthcare, and energywho are tired of executives walking into meetings with two dashboards and three definitions of margin.

My focus is simple to state and hard to execute:

Design semantic models that your business, your AI, and your governance can all live with—at the same time.

If you’re building on Fabric and you know that reports, AI, and governance are all pulling on the same thread, the semantic layer, but you don’t have the time or appetite to untangle it alone, that’s where partnership makes sense.

Isaac Truong| Founder, Allston Yale Strategic Data Architecture & AI Readiness for the Enterprise Mid‑Market

If you’re a partner or leader who wants Fabric to be a platform, not just a reporting tool, and you’re ready to treat semantic models as your real product,let’s talk.

What domain would you want to fix first if you could snap your fingers, Revenue, Operations, Inventory, or something else?


Isaac Truong | Founder, Allston Yale

Enterprise-grade analytics for $50M–$100M SMBs

Power BI | Fabric | Azure | Data Strategy

📅 Book a 20-min Fabric diagnostic →

📧 Subscribe to get Friday Fabric Facts in your inbox (plus early access to templates) 💼

LinkedIn: Connect with me for daily Fabric tips


Friday Fabric Facts #6: Originally Posted on LinkedIn, March 6, 2026

Friday Fabric Facts #7: Governance Isn’t a Brake on Fabric – It’s the Only Way to Go Fast Without Crashing

If you say “governance” in most organizations, people heardelay.

They picture review boards, approval queues, and an inbox full of “please justify this request.” In the old world--where provisioning anything took weeks, governance did often show up late, as a gate.

Fabric flips that on its head.

Fabric assumes that:

  • Any motivated user can spin up a workspace in minutes.
  • Data from multiple systems can be mirrored, shortcut‑linked, or pipelined into OneLake with very little friction.
  • AI assistants and Copilot can sit on top of models and answer questions with natural language.

That’s not a slow environment. That’s adangerously fastone.

In a platform that makes it this easy to create, share, and automate,governance isn’t about slowing people down. It’s about making sure the speed doesn’t kill you.

The Real Problem: “We’ll Lock It Down Later”

When Fabric arrives in a mid‑market organization, the story usually starts the same way:

  1. Someone champions Fabric as the next evolution of their analytics platform.
  2. Senior leadership says, “Let’s not strangle this with bureaucracy—we’ve been waiting years for something like this.”
  3. Tenant settings are left broad “to encourage exploration.”
  4. Teams are told, explicitly or implicitly:“Just start building; we’ll sort out structure and governance later.”

“Later” never arrives.

Six to eighteen months in, the symptoms emerge:

  • Workspace sprawl:Hundreds of workspaces with overlapping names (“Sales Analytics,” “Sales Reports v2,” “Sales (New)”), and no one can tell which is canonical.
  • Ownership ambiguity:Workspaces where the only “Owner” is a shared service account or someone who left the company.
  • Shadow standards:A sandbox report, built quickly “for a meeting,” quietly becomes the de facto quarterly pack. No one ever went back and hardened the model behind it.
  • Auditor questions you can’t answer:“Who had access to this dataset when this figure was published?” “What sources feed this dashboard?” and silence while people dig through email threads and chat logs.nttdata-solutions+1

The irony is that governance isn’t absent in these environments—it’s justreactive. It shows up after there’s already friction, risk, or pain.

In Fabric, that’s too late. The platform isoptimizedfor rapid spread.

Fabric’s View of Governance: Not Centralized Control, but Structured Delegation

If you read Microsoft’s governance documentation closely, the message is nuanced: governance in Fabric isfederated by design.

Instead of a single, monolithic control plane, you get four aligned layers:

  1. Tenant Settings – The Non‑NegotiablesThese are the “laws of physics” for your Fabric tenant:
  2. Domains – Who Owns WhatDomains group workspaces by business function or data domain—Sales, Finance, Supply Chain, Clinical, etc.daymarksi+1
  3. Workspaces – The Team BoundaryWorkspaces are where actual work happens: models, reports, notebooks, pipelines.
  4. Purview & Audit – The Cross‑Cutting ViewPurview integration, lineage, sensitivity labels, and audit logs give you visibility:

When you put these together, Fabric governance stops looking like “one big on/off switch” and starts looking likean operating model.

A Field Story: The Orphaned Workspace Jungle

A pattern I keep seeing in organizations between $50M and $100M revenue:

  • Fabric has been live “in some form” for about a year.
  • Usage is high. People genuinely love the flexibility.
  • But under the covers, the landscape looks like this:

Then something triggers concern:

  • An internal audit noticing inconsistent numbers across different reports.
  • A near‑miss incident where a report with sensitive data was almost shared with the wrong group.
  • A partner asking harder questions about data lineage and governance before signing an agreement.

Suddenly, the same leadership that didn’t want to “slow things down with governance” wants clarity:

  • “Which workspaces matter?”
  • “Who owns them?”
  • “Which ones pose risk if they’re mis‑configured?”

At that point, governance becomes aforensics exercise—digging through layers of organic growth instead of designing from intent.

The hard lesson: in Fabric, if you don’t establishownership, domains, and high‑level rules early, the platform will happily help you grow a jungle you eventually have to mow.

Where Business Structure Meets Technical Control

Among all the governance features,domainsare the most misunderstood—and the most powerful—for creating order without centralizing everything.

Domains let you say:

  • “All Finance‑related workspaces live here and are overseen by these people.”
  • “Clinical or Patient data assets must live within this domain, with heightened scrutiny.”
  • “Partner‑facing datasets belong in this domain, with specific sharing and API rules.”

From a Microsoft perspective, domains are how you:daymarksi+1

  • Scale governance without funneling every decision through a single admin team.
  • Assign domain admins who understand themeaning and riskof the data, not just its schema.
  • Align data product ownership to business responsibility.

From a practical perspective, domains are how you answer executives when they ask:

  • “Who is responsible for our revenue definitions?”
  • “Where does all our clinical data live in Fabric?”
  • “Which part of Fabric should an auditor care about first?”

Without domains, Fabric is just a flat ocean of workspaces. With domains, you getlanes.

Governance as Product Thinking: Design the Experience, Not Just the Rules

The organizations I see thriving with Fabric governance don’t start by writing 30 pages of policy. They start by designing an experience:

  • When a new team wants to build something, what’s thedefault path?
  • What’s the minimum friction that still ensures they land in the right domain, with the right workspace structure and ownership?
  • What’s the simplest way to discover “blessed” models and reports versus experiments?element61+2

They treat governance like product management:

  • Onboarding:How easy is it for a legitimate team to do the right thing?
  • Guardrails:What happens if someone does nothing—do sane defaults protect them (and you)?
  • Feedback:Can you see when governance is getting in the way, and adjust?

Fabric’s documentation hints at this “governance as product” mindset:

  • Encouragingcertified contentand clear endorsement patterns instead of endless duplication.smartbridge+1
  • Promotingfederated domain adminsover a single central gatekeeper.
  • Using Purview not just to check compliance, but to make data discovery easier and safer.

This is what separates “paper governance” fromoperational governance.

You Don’t Need a Bank’s Governance Model

It’s easy to look at Microsoft’s governance diagrams and think, “We’re not a global bank. We can’t do all of this.”

You don’t have to.

For SMBs and lean mid‑market teams, an effective Fabric governance approach often looks like this:

  • 2–5 well‑named domains, mapped to real business units (e.g., Revenue, Operations, Finance, Clinical, Supply), not vague labels.smartbridge+1
  • A small set of locked‑down tenant settings, especially around:
  • Workspace standards, written in plain language:
  • Audit and lineage turned on early, so you have a trail by default.

This isn’t about building a complex committee structure. It’s about:

  • Making risky actionsslightly harder.
  • Making safe, reusable patternsmeaningfully easier.
  • Giving yourself enough visibility that surprises are rare.

You don’t need ten people doing governance. You needone person who understands the levers, anda few leaders willing to own their domains.

Governance, AI, and Semantics: The Same Conversation

By Issue #5 and #6, we’ve talked about Copilot, agents, and semantic models. Governance is not a separate topic from those--it’s the frame that holds them together.

  • Semantic modelsdefine what the business means.
  • Governancedefines who can change, see, and reuse those meanings.
  • AI (Copilot, agents, Fabric IQ)amplifies whatever you’ve modeled and governed—good or bad.

Weak governance in a world without AI was painful. Weak governance in a world where natural language agents can answer questions from any model they can see is dangerous.

This is why Microsoft keeps tying Fabric governance to Purview, sensitivity labels, and AI safety guidance: they are not separate problems.

If your governance is thoughtful, AI becomes a force multiplier. If your governance is accidental, AI becomes a liability accelerator.

Most Fabric projects I encounter have three tracks:

  • Thetechnical track– “Can we get the data in, modeled, and visualized?”
  • TheAI track– “Can we demo Copilot or an agent that impresses leadership?”
  • Thegovernance track– “Can we make sure we’re not creating audit and security headaches?”

Too often, that third track is understaffed, under‑owned, or bolted on at the end.

I work at the intersection of all three:

  • Helpingpartnersdesign Fabric rollouts where governance is a selling point, not a disclaimer in the SOW.
  • HelpingCIOs, CDOs, and CTOsin the mid‑market designjust enoughstructure—domains, tenant policies, ownership models—to let their teams move fast without courting disaster.
  • Helpingbusiness owners in regulated or sensitive domainsuse Fabric as a differentiator (better lineage, better control, better trust), not as another thing Compliance worries about.

I’m not interested in governance theater. I’m interested in environments where:

  • Users know where to go for the right numbers.
  • Leaders know who owns what.
  • AI can be trusted because the data and access beneath it are intentional.

If you’re rolling out Fabric and want your governance story to be as sharp as your technical story and you’d rather not figure it out by trial and error, that’s where it makes sense to talk.


Isaac Truong | Founder, Allston Yale

Enterprise-grade analytics for $50M–$100M SMBs

Power BI | Fabric | Azure | Data Strategy

📅 Book a 20-min Fabric diagnostic →

📧 Subscribe to get Friday Fabric Facts in your inbox (plus early access to templates) 💼

LinkedIn: Connect with me for daily Fabric tips


Friday Fabric Facts #7: Originally Posted on LinkedIn, March 13, 2026

How Can My Business Migrate from Oracle to Microsoft Fabric Successfully

How Can My Business Migrate from Oracle to Microsoft Fabric Successfully

Transitioning from Oracle to Microsoft Fabric is a strategic move for small teams that feel buried under complex infrastructure. You need a system that manages the plumbing so you can focus on the business value of your data. This transition shifts your focus from database administration to delivering actionable insights.

Allston Yale Serves Businesses in Texas and across the USA

  • The Power of SaaS for Lean Teams

    Building a modern data stack used to require a massive engineering team to glue different tools together. Microsoft Fabric changes that by offering this unified platform approach that puts everything in one place. You get storage, compute, and visualization in a single workspace which is a game changer for firms.

  • Simplifying Data Movement

    The heavy lifting of moving data from legacy systems is often the biggest hurdle for IT pros. By using Mirroring functionality you can replicate your Oracle data into OneLake without writing complex code. This allows your small team to move faster and spend less time troubleshooting broken pipelines every single morning.

  • Focus on Business Outcomes

    A successful transition is not about the technology itself but about the problems you are solving for your company. You should prioritize the reports that your leadership actually uses to make daily decisions. When you deliver these quickly in a new environment you build the trust needed to modernize the rest of your stack.

  • Efficiency Through Consolidation

    Consolidating your tools into one environment helps reduce the cognitive load on your already stretched IT staff. Instead of jumping between different vendors you have one interface for everything from engineering to reporting. This efficiency lets your team behave like a much larger department without adding any new headcount.

  • Embracing Modern Data Architecture

    Modernizing your data architecture is about survival in a market where your competitors are using AI. If you are still stuck in manual spreadsheets and legacy databases you are losing margin every single day. Moving to a SaaS platform like Fabric is the first step toward becoming a truly data driven organization today.

Why Is This Transition Important For Your Business Strategy?

The world of data is changing fast and legacy databases are becoming a massive anchor for small businesses. Keeping an Oracle environment running requires specialized skills that are expensive and hard to find in this market. If you want to outclass your competition you have to move to a platform that scales with your growth.

  • The End of Technical Silos

    Legacy systems often keep data locked in silos where only a few technical people can reach it. This creates a bottleneck that slows down decision making across the entire company. Fabric breaks these walls down by making data accessible to everyone who needs it through a familiar and intuitive interface for all users.

  • Managing Licensing Changes

    The landscape of software costs is shifting and you need to be aware of how licensing shifts impact your budget. Staying on old platforms can lead to unexpected price hikes that eat into your profits. Transitioning now allows you to take control of your spending with more predictable and flexible options.

  • Comparing Market Leaders

    When you look at how market analysis reports compare these platforms the integration story is clear. Microsoft offers a more cohesive experience for companies already using Office 365 or Azure tools. This familiarity reduces the learning curve for your team and helps you achieve a faster return on investment.

Comparing Oracle Database & Microsoft Fabric

.bi-table-wrapper { overflow-x: auto; max-width: 100%; } .bi-table { width: 100%; min-width: 700px; border-collapse: collapse; margin: auto; background-color: #fff; color: black; box-shadow: 0 0 10px rgba(0,0,0,0.1); } .bi-table caption { caption-side: top; font-size: 1.6rem; font-weight: bold; padding: 1rem; color: #00897F; text-align: center; } .bi-table th, .bi-table td { padding: 12px 20px; text-align: center; border-bottom: 1px solid #ddd; } .bi-table th { background-color: #00897F; color: white; } .bi-table tr:hover { background-color: #f1f1f1; } .bi-table tbody tr:nth-child(even) { background-color: #f9f9f9; } @media (max-width: 600px) { .bi-table { min-width: 100%; } .bi-table caption { font-size: 1.2rem; padding: 0.75rem; } .bi-table th, .bi-table td { padding: 8px 10px; font-size: 0.9rem; } }
Feature Oracle Database Microsoft Fabric
Deployment Model On-premises or IaaS Pure SaaS Environment
Data Integration Complex ETL Processes Native Data Mirroring
Storage Format Proprietary Row/Col Open Delta Parquet
Primary User Database Admin Data Analyst & Engineer
Visualization Separate Tools Needed Integrated Power BI

The table above highlights that the primary difference lies in the move from a technical database to a unified data platform. Oracle requires heavy maintenance and specialized DBA knowledge to keep the lights on every day. Fabric simplifies this by using open formats and integrated tools that allow analysts to do more work.

  • Staying Current with Innovation

    Microsoft is investing heavily in this platform and recent feature updates show a rapid pace of innovation. If you stay on legacy systems you miss out on new AI capabilities and automated features that could save you time. You want to be on a platform that is actively evolving to solve your future problems.

  • Reducing Management Overhead

    Managing a database involves patching, backups, and performance tuning which takes up hours of your time. Fabric handles these tasks automatically because it’s a managed service. This frees up your IT team to work on projects that actually move the needle for your business like predictive analytics or better dashboards.

  • Improving Data Trust

    When data is scattered across legacy systems people stop trusting the numbers they see in their reports. A unified platform provides a single source of truth that everyone can agree on during meetings. Building this trust is essential if you want your leadership to rely on your work for major strategic moves.

  • Scalability for Growth

    A small company today might be a large firm tomorrow and your tech stack needs to handle that. Fabric allows you to start small and scale your capacity as your data volume and user count increase. This flexibility ensures that you are never paying for more than you actually need at any given moment in time.

What Does the Migration Actually Cost and Require?

Budgeting for a migration is about more than the sticker price of the software licenses you buy. You have to account for the time your team spends learning and the potential for temporary dual billing. Understanding the full picture helps you set realistic expectations with your CFO before you start the project.

Licensing and Time Costs

.bi-table-wrapper { overflow-x: auto; max-width: 100%; } .bi-table { width: 100%; min-width: 700px; border-collapse: collapse; margin: auto; background-color: #fff; color: black; box-shadow: 0 0 10px rgba(0,0,0,0.1); } .bi-table caption { caption-side: top; font-size: 1.6rem; font-weight: bold; padding: 1rem; color: #00897F; text-align: center; } .bi-table th, .bi-table td { padding: 12px 20px; text-align: center; border-bottom: 1px solid #ddd; } .bi-table th { background-color: #00897F; color: white; } .bi-table tr:hover { background-color: #f1f1f1; } .bi-table tbody tr:nth-child(even) { background-color: #f9f9f9; } @media (max-width: 600px) { .bi-table { min-width: 100%; } .bi-table caption { font-size: 1.2rem; padding: 0.75rem; } .bi-table th, .bi-table td { padding: 8px 10px; font-size: 0.9rem; } }
Category Estimated Cost Detail Expected Timeline
Software Licensing F-SKU Capacity Billing Immediate Availability
Team Training Learning New Workflows Two to Four Weeks
Data Migration Extraction and Loading Four to Eight Weeks
Report Refactoring Rebuilding Top Views Three to Six Weeks

This table shows that the biggest investment for a small team is the time required for data movement and training. While the software costs are predictable you must plan for the transition period where both systems might be active. Focus on a phased approach to manage these costs effectively while proving value to the business.

Oracle vs Fabric Capacity

The real-world difference between an Oracle Database and Fabric F-SKUs is how you pay for power. Oracle often requires large upfront costs for licenses that are tied to specific hardware or cores. Fabric F-SKUs use capacity requirements that you can scale up or down based on your actual daily usage.

Performance and Scalability

.bi-table-wrapper { overflow-x: auto; max-width: 100%; } .bi-table { width: 100%; min-width: 700px; border-collapse: collapse; margin: auto; background-color: #fff; color: black; box-shadow: 0 0 10px rgba(0,0,0,0.1); } .bi-table caption { caption-side: top; font-size: 1.6rem; font-weight: bold; padding: 1rem; color: #00897F; text-align: center; } .bi-table th, .bi-table td { padding: 12px 20px; text-align: center; border-bottom: 1px solid #ddd; } .bi-table th { background-color: #00897F; color: white; } .bi-table tr:hover { background-color: #f1f1f1; } .bi-table tbody tr:nth-child(even) { background-color: #f9f9f9; } @media (max-width: 600px) { .bi-table { min-width: 100%; } .bi-table caption { font-size: 1.2rem; padding: 0.75rem; } .bi-table th, .bi-table td { padding: 8px 10px; font-size: 0.9rem; } }
Metric Oracle Performance Fabric F-SKU Performance
Scaling Manual and Disruptive Instant and Seamless
Cost Control Fixed and High Flexible and Granular
Maintenance High Admin Effort Zero Admin Effort
Peak Loads Limited by Hardware Burstable Capacity

This comparison demonstrates that Fabric provides a more elastic environment for businesses with varying workloads. You can pause your capacity during off hours or scale it up during heavy month end reporting cycles. This level of control is simply not possible with traditional database licensing models used by legacy vendors.

The Sweet Spot for SMBs

For a mid sized business the F64 SKU is often the best place to start your journey. This level provides enough power to handle enterprise features like OneSecurity and advanced AI capabilities. It also includes the benefit of free Power BI Pro usage for your viewers which can save a massive amount of money.

Choosing Your Starting SKU

.bi-table-wrapper { overflow-x: auto; max-width: 100%; } .bi-table { width: 100%; min-width: 700px; border-collapse: collapse; margin: auto; background-color: #fff; color: black; box-shadow: 0 0 10px rgba(0,0,0,0.1); } .bi-table caption { caption-side: top; font-size: 1.6rem; font-weight: bold; padding: 1rem; color: #00897F; text-align: center; } .bi-table th, .bi-table td { padding: 12px 20px; text-align: center; border-bottom: 1px solid #ddd; } .bi-table th { background-color: #00897F; color: white; } .bi-table tr:hover { background-color: #f1f1f1; } .bi-table tbody tr:nth-child(even) { background-color: #f9f9f9; } @media (max-width: 600px) { .bi-table { min-width: 100%; } .bi-table caption { font-size: 1.2rem; padding: 0.75rem; } .bi-table th, .bi-table td { padding: 8px 10px; font-size: 0.9rem; } }
Business Size Recommended SKU Primary Benefit
Small Office F2 to F8 Low Entry Price
Mid-Sized Firm F32 to F64 Includes PBI Features
Large Enterprise F128 and Above Maximum Performance

Most of our clients find that starting with an F64 SKU allows them to consolidate their Power BI licensing while gaining full platform access. This SKU acts as a bridge that provides professional features without the massive price tag of legacy premium capacities. It’s the most logical choice for a team looking to grow fast.

Production Timeline for Reports

Standing up a production environment for your top three reports usually takes about six to eight weeks of focused work. This includes setting up the workspace and ingesting the necessary data from your source systems. You should not aim for perfection in the first month but focus on getting accurate data to users.

Typical Implementation Stages

.bi-table-wrapper { overflow-x: auto; max-width: 100%; } .bi-table { width: 100%; min-width: 700px; border-collapse: collapse; margin: auto; background-color: #fff; color: black; box-shadow: 0 0 10px rgba(0,0,0,0.1); } .bi-table caption { caption-side: top; font-size: 1.6rem; font-weight: bold; padding: 1rem; color: #00897F; text-align: center; } .bi-table th, .bi-table td { padding: 12px 20px; text-align: center; border-bottom: 1px solid #ddd; } .bi-table th { background-color: #00897F; color: white; } .bi-table tr:hover { background-color: #f1f1f1; } .bi-table tbody tr:nth-child(even) { background-color: #f9f9f9; } @media (max-width: 600px) { .bi-table { min-width: 100%; } .bi-table caption { font-size: 1.2rem; padding: 0.75rem; } .bi-table th, .bi-table td { padding: 8px 10px; font-size: 0.9rem; } }
Stage Activity Duration
Foundation Workspace Setup One Week
Data Ingest Mirroring Oracle Two Weeks
Development Building Dashboards Three Weeks
Validation Testing and UAT Two Weeks

As shown in the timeline above you can move from nothing to live reports in a very short period. This speed is only possible because you are using a SaaS platform that removes the need for server provisioning. By focusing on your most important metrics you can show a win to your leadership before they lose interest.

Three Non-Negotiable Success Steps

To ensure your first migration project is a success you must follow three critical steps without any shortcuts. First, you must inventory your data to see what actually needs to move. Second, you must implement a strong governance plan. Finally, you must train your users so they actually adopt the new system you built.

Migration Success Framework

.bi-table-wrapper { overflow-x: auto; max-width: 100%; } .bi-table { width: 100%; min-width: 700px; border-collapse: collapse; margin: auto; background-color: #fff; color: black; box-shadow: 0 0 10px rgba(0,0,0,0.1); } .bi-table caption { caption-side: top; font-size: 1.6rem; font-weight: bold; padding: 1rem; color: #00897F; text-align: center; } .bi-table th, .bi-table td { padding: 12px 20px; text-align: center; border-bottom: 1px solid #ddd; } .bi-table th { background-color: #00897F; color: white; } .bi-table tr:hover { background-color: #f1f1f1; } .bi-table tbody tr:nth-child(even) { background-color: #f9f9f9; } @media (max-width: 600px) { .bi-table { min-width: 100%; } .bi-table caption { font-size: 1.2rem; padding: 0.75rem; } .bi-table th, .bi-table td { padding: 8px 10px; font-size: 0.9rem; } }
Step Action Item Reason for Importance
1. Discovery Audit All Existing Reports Avoid Moving Garbage
2. Automation Use Mirroring Tools Reduce Manual Coding
3. Adoption Conduct User Workshops Ensure Tool Usage

Following these steps prevents the common mistake of simply moving your old problems into a new environment. You should use this migration as an opportunity to clean up your data models and retire reports that nobody looks at anymore. Engaging your users early in the process ensures that the final product meets their actual needs.

How To Start Your Journey Toward A Modern Data Stack

Moving from Oracle to Microsoft Fabric is a big step but it’s the right one for any lean IT team. You are trading manual labor and complex maintenance for a streamlined system that prioritizes business value. This shift allows you to act as a partner to your business rather than just a cost center that manages servers.

  • Leveraging Enterprise Features

    As you grow you can start to explore enterprise features that were previously out of reach for small firms. Things like machine learning and real time analytics become accessible when your data is in OneLake. These tools give your company the ability to predict trends instead of just reporting on the past.

  • Following a Proven Path

    Many organizations have already made this move and you can learn from their experiences by reading migration frameworks online. Don't feel like you have to reinvent the wheel when there are clear steps to follow. Reach out to the community if you get stuck because there are many experts willing to help you.

  • Solving Technical Hurdles

    If you encounter specific issues with your data sources check the community discussions for proven solutions. There is almost always a workaround for complex extraction scenarios that other engineers have already figured out. Using these resources saves you from wasting hours on problems that are already solved.

  • Practical Migration Advice

    When you start the technical work refer to technical migration guides to avoid common pitfalls during the process. These guides offer hands on advice that can help you configure your connections correctly the first time. Being prepared for the technical details will make your transition much smoother and less stressful.

  • Take the Next Step

    The best time to start modernizing your data environment is right now before your legacy systems become a bigger liability. You don't have to do this alone and having an expert look at your current setup can save you months of trial and error. My team is ready to help you navigate this complex landscape and find the best path forward.

Partner With the Microsoft Fabric Consultant You Can Trust

If you are ready to turn your data chaos into a strategic asset, don’t hesitate to book a free data check up with Allston Yale today. As expert Microsoft Fabric consultants, we can look at your current Oracle setup and help you build a roadmap for a successful Fabric migration. Let's get your data working for you so you can focus on growing your business.

Sources

How Do I Migrate My Business from an SQL Server to Microsoft Fabric

How Do I Migrate My Business from an SQL Server to Microsoft Fabric?

Moving a lean team from a local SQL Server to the cloud is a massive undertaking that requires a strategic shift in how you handle data. Microsoft Fabric simplifies this by unifying your entire stack into a single SaaS environment. This platform allows your small team to act like a much larger unit.

Allston Yale Serves Businesses in Texas and across the USA

Platform Unification

By consolidating storage and compute, you eliminate the need to juggle separate vendors for engineering and visualization. This unified approach enables your IT staff to focus on delivering business value instead of managing infrastructure. Fabric provides the tools to modernize your data stack quickly.

Simplifying Data Tasks

Small teams often feel like they have to be superman to handle infrastructure and analytics at the same time. Fabric reduces this burden by automating many of the complex tasks that previously required a whole engineering department. It creates a space where your data can finally serve the needs of the people.

Scaling Small Teams

You don’t need a massive budget to achieve world class results when you use the right tools. Fabric allows a handful of people to manage vast amounts of information with ease. It shifts the conversation from maintaining servers to uncovering insights that help your organization outclass every competitor.

Why Modernization Matters

Modern businesses are often buried under disjointed reports that make absolutely no sense to the leadership team. Legacy systems create silos where information sits stale and inaccessible to the people who need it most. Transitioning to a modern platform is about survival in a world where speed defines success.

  • Centralizing Information

    OneLake addresses the primary problem of fragmented data by creating a single source of truth for the entire company. This setup prevents the common issue of different departments looking at conflicting numbers during big meetings. It ensures that your strategic moves are always based on accurate and unified facts.

  • Real Time Insights

    The integration of Direct Lake technology allows users to access raw information without the lag of traditional refresh cycles. This capability is game changing for firms that previously waited days for processing. It turns your data into a live asset that informs decisions as they happen.

  • Eliminating Manual Work

    Many firms lose significant profits due to delayed decisions caused by manual spreadsheets and static reports. Fabric replaces these inefficient workflows with automated dashboards that update in real time. This shift allows your team to spend less time on data entry and more time on high level problem solving.

  • Trusting Your Data

    When your analytics are a total mess, nobody wants to rely on them for making important business choices. A unified platform builds trust by providing clear visibility into where your information comes from. This transparency is essential for turning your organization into a truly data driven powerhouse today.

  • Strategic Decisions

    Leadership needs to see that becoming data driven is a major component to winning in their specific industry. High quality dashboards turn raw numbers into intuitive stories that anyone can understand. This clarity allows executives to make massive strategic moves with total confidence in their underlying evidence.

  • Competitive Advantage

    Firms stuck in manual workflows are often much slower to market than their more modern competitors. By upgrading your tech stack, you ensure that your team is not left behind. Using advanced tools like machine learning and AI helps you uncover trends that were previously hidden in your legacy SQL databases.

Comparing an SQL Server vs Microsoft Fabric

.bi-table-wrapper { overflow-x: auto; max-width: 100%; } .bi-table { width: 100%; min-width: 700px; border-collapse: collapse; margin: auto; background-color: #fff; color: black; box-shadow: 0 0 10px rgba(0,0,0,0.1); } .bi-table caption { caption-side: top; font-size: 1.6rem; font-weight: bold; padding: 1rem; color: #00897F; text-align: center; } .bi-table th, .bi-table td { padding: 12px 20px; text-align: center; border-bottom: 1px solid #ddd; } .bi-table th { background-color: #00897F; color: white; } .bi-table tr:hover { background-color: #f1f1f1; } .bi-table tbody tr:nth-child(even) { background-color: #f9f9f9; } @media (max-width: 600px) { .bi-table { min-width: 100%; } .bi-table caption { font-size: 1.2rem; padding: 0.75rem; } .bi-table th, .bi-table td { padding: 8px 10px; font-size: 0.9rem; } }
Feature On-Premises SQL Server Microsoft Fabric
Scaling Manual hardware upgrades Instant elastic scaling
Integration Requires complex ETL Native OneLake integration
Maintenance High (Patching, Backups) Low (SaaS Managed)
AI Readiness Limited / Manual Built-in Copilot and ML
Licensing Per Core / Perpetual Capacity-based (F-SKUs)
Performance Disk/IO Dependent Direct Lake / Memory Speed

The comparison shows that Fabric offers superior scalability and integration compared to traditional SQL Server setups. While on-premises systems provide familiarity, they lack the automated features and AI readiness found in the cloud. Transitioning allows your lean team to leverage advanced tools without extra staff.

  • ROI Expectations

    Investing in Fabric leads to a significant return on investment by cutting the time spent on data processing. Many organizations see their efficiency shoot through the roof within just a few months of adoption. The cost of inaction is much higher when you consider the risks of relying on outdated systems.

  • Operational Efficiency

    Modernizing your stack turns your data from a tough obstacle into your biggest ally. Your IT team can finally stop acting as a cost center and start functioning as a strategic asset. Efficiency gains come from removing the silos that prevent your departments from working together on shared goals.

  • Future Readiness

    Preparing for a future where data drives every single strategic move requires a robust foundation. Fabric provides that foundation by being built for the next generation of analytics and intelligence. You are not buying a tool for today, but rather building a platform that will grow with your company.

Costs, SKUs, and Timelines

Understanding the financial and time commitment is essential before you start your migration journey. Lean teams need to be realistic about what it takes to stand up a production environment that works. You must evaluate the total cost of ownership compared to your existing on premises maintenance fees.

  • Financial Planning

    The transition involves moving from physical hardware costs to a flexible cloud consumption model. You will find that the investment pays off by reducing the time your IT staff spends on low value maintenance tasks. It’s important to communicate these long-term savings clearly to your CFO to secure the budget.

  • Capacity Licensing

    Licensing involves moving from perpetual SQL cores to a consumption model known as Fabric Capacity. This shift allows you to scale your resources up or down based on your actual usage patterns. It provides more flexibility than being locked into rigid hardware cycles that sit underutilized.

  • Modern Workloads

    The real-world difference lies in how you pay for compute power versus fixed storage limits. SQL Server licenses are often tied to physical hardware, while F-SKUs are elastic and manageable via a portal. This new structure supports modern workloads that require high performance for artificial intelligence.

  • The F64 Option

    For a mid-sized business, the F64 SKU is often the sweet spot because it includes Power BI features. This level of capacity provides enough horsepower to handle complex engineering tasks without breaking the bank. It represents the best balance of performance and price for a growing lean organization.

  • Project Timelines

    Standing up a production environment for your top three reports typically takes between six to eight weeks. This timeline assumes you have a clear understanding of your source data and business requirements. It’s a sprint to demonstrate value to stakeholders who are eager for actionable insights.

  • First Report Success

    Focusing on your most impactful reports first ensures that you gain early wins and build momentum. Don’t try to move everything at once, or you risk overwhelming your small team. Successful projects start with a narrow scope that addresses a specific pain point for your leadership or operations staff.

  • Strategic Scenarios

    Choosing the right migration path is the first non-negotiable step for any successful project. You must evaluate different scenarios to determine if a lift and shift or a full redesign is appropriate. This decision impacts your long-term maintenance costs and the overall agility of your new data platform.

  • Successful Migration

    The second non-negotiable step is following a structured roadmap to move your objects while minimizing downtime. You should use a guide to ensure that your schemas and stored procedures are optimized for the cloud. Clear communication with your users during this phase is vital for maintaining their trust.

  • Essential Governance

    Establishing rock solid policies for data quality and security is the third essential step. You need a comprehensive plan to ensure that your modern platform remains organized and trustworthy. Without proper governance, your new environment will quickly become as chaotic as the legacy system it replaced.

Where Do You Go From Here?

Migrating to Microsoft Fabric is a massive undertaking that will turn your data into a strategic powerhouse. It moves your IT team from being a cost center to a value driver for the whole company. By following a structured roadmap, you can overcome the challenges of legacy infrastructure and win quickly.

  • Overcoming Obstacles

    Navigating a complex landscape filled with changing technologies is exhausting for any CIO. However, the rewards of a successful migration far outweigh the initial hurdles you might face. Focus on cultivating a data-first culture where every team member learns to live and breathe the new insights.

  • Culture Shifts

    Getting your organization to embrace new tools is often more about people than technology. You must show that you care about being a problem solver rather than just a report builder. Training your staff to tell stories with data turns resistant employees into strong advocates for your modernization efforts.

  • Infrastructure Growth

    A scalable infrastructure ensures that you can meet the increasing demands of your business without constant retooling. Fabric provides the robustness needed to safeguard your information while allowing for rapid growth. Your policies for quality and compliance will build strong trust across all your various departments.

  • Cross Team Success

    Breaking down silos promotes collaboration and helps different teams work together on shared insights. Reports that span from order to cash help everyone see the big picture of how the company operates. This visibility is game changing for organizations that previously struggled with disjointed and messy information.

  • Advanced Analytics

    Utilizing tools like Power BI and machine learning allows you to uncover trends that inform proactive decision making. You will no longer be reacting to old news, but rather anticipating the needs of your market. This proactive approach is what separates the industry leaders from those who are merely surviving.

  • Continuous Improvement

    Your journey toward becoming a data driven powerhouse does not end with the first successful migration. It’s an ongoing process of refining your models and expanding your reach within the organization. Stay curious and keep asking the right questions that lead to better business outcomes for your firm.

Partner With Allston Yale for Powerful & Positive Change

If you want to ensure your infrastructure is ready for this shift, Allston Yale's Microsoft Fabric consultancy services can help you navigate the process. Our team is ready to analyze your current environment and provide a clear path forward for your team. You can book a free data check up with Allston Yale to start your journey today.

Sources

How Do I Transition My Business from Azure SQL Server to Microsoft Fabric

How Do I Transition My Business from Azure SQL Server to Microsoft Fabric?

Moving from Azure SQL to Microsoft Fabric involves shifting from a siloed database mindset to a unified SaaS data ecosystem. For a lean IT team, this means moving your data into OneLake to enable real-time analytics without the burden of complex ETL pipelines or infrastructure management. Success requires a focus on consolidating tools and simplifying the stack.

Allston Yale Serves Businesses in Texas and across the USA

  • Unified Infrastructure

    Traditional environments require you to manage server scaling and security across multiple disconnected services. By adopting a consolidated platform, your small team can finally focus on delivering business value instead of wasting time on maintenance tasks that eat up your entire weekly schedule. Utilizing a successful Microsoft Fabric migration involves aligning your technology with clear business goals.

  • Simplified Management

    Managing several separate vendors for engineering and visualization creates a chaotic environment for a small group. Fabric integrates these functions into a single workspace, which reduces the mental load on your IT staff. This shift allows you to manage security and governance from one central location rather than jumping between different portals.

  • Strategic Data Use

    When you spend less time on infrastructure, you have more energy to solve actual business problems. Lean teams must prioritize the requests that drive the most revenue for the organization. Adopting these tips to successfully migrate to Microsoft Fabric will ensure your team stays focused on high-impact projects instead of getting stuck in the technical weeds.

  • Future Proofing

    The transition is not about moving data but about changing how your company interacts with information. By leveraging a modern platform, you are setting your organization up to outclass competitors who are still stuck in Excel hell. Your small team can act like a much larger department when the tools do the heavy lifting for you.

Why OneLake Is the Solution for Modern Businesses

Data silos are the silent profit killer in most mid-sized companies today. Information gets trapped in different departments, which leads to disjointed reports and delayed decisions. OneLake addresses this by providing a single, unified location for all your organizational data, much like how OneDrive handles your files.

  • Eliminating Data Silos

    Fragmented data leads to mispriced bids and missed opportunities in every industry. When finance and operations look at different numbers, trust in the system collapses. OneLake creates a single source of truth that ensures every stakeholder is looking at the same information in darn-near-real-time. This unification of databases and Fabric on a single platform is a massive game changer for lean IT teams.

  • Reducing ETL Complexity

    Most IT professionals spend their lives building and fixing fragile data pipelines. These pipelines are often the weakest link in your architecture. OneLake uses a shortcut feature that allows you to access data without moving it physically. This reduces the risk of errors and saves your team from the nightmare of manual data entry.

  • Democratizing Information

    When data is easily accessible, non-technical teams can start to find their own insights. This reduces the burden on your IT staff to create every single one-off report. By lowering the barrier to entry, you turn your entire organization into a data-driven powerhouse. A Microsoft Fabric pricing guide can help you understand how to scale this access across the firm efficiently.

  • Enhancing Real Time Decisions

    Legacy systems often take days to process simple reports, which is unacceptable in a fast-paced market. OneLake enables faster processing times so you can spot budget overruns before they become disasters. Moving from a static environment to a fluid one allows your leadership to make strategic moves with total confidence.

  • Scaling With Ease

    Small IT teams often worry about outgrowing their infrastructure too quickly. OneLake is designed to scale with your business needs without requiring a total overhaul of your tech stack. You can start small and expand your storage and compute power as your data requirements grow. This flexibility is vital for any growing SMB.

  • Improving Security

    Managing permissions across ten different databases is a recipe for a security breach. OneLake simplifies this by allowing you to set universal policies that apply to all your data assets. Your team can rest easier knowing that sensitive information is protected by a robust and centralized governance framework.

  • Fostering Collaboration

    When departments share a common data lake, they start to collaborate instead of competing. Shared insights, such as a unified order to cash report, help siloed teams work together toward a common goal. This cultural shift is perhaps the most significant benefit of modernizing your data infrastructure.

  • Reducing Waste

    Siloed systems often lead to duplicate data storage and redundant processing costs. OneLake eliminates this waste by keeping only one copy of the data that multiple services can access. This efficiency not only saves money but also keeps your environment clean and organized.

  • Empowering Leadership

    Leaders need clarity to drive the company forward, and OneLake provides that by removing technical friction. When the CEO can trust the dashboard, your IT team is seen as a strategic asset rather than a cost center. This shift in perception is crucial for securing future budgets and project approvals.

Costs, Licensing, and Implementation Realities

Understanding the financial and temporal commitment is the first step toward a successful migration. Lean teams cannot afford to guess on budgets or timelines. You need to know exactly what you are getting into before you flip the switch. This section breaks down the costs and the roadmap for your transition.

Money, Time, and Licensing

Licensing for Fabric is different from traditional SQL Server models because it focuses on capacity rather than individual cores. You pay for a specific level of compute power that all your data tasks share. According to a Microsoft Fabric pricing and licensing guide, this model allows for better cost predictability as you scale your operations.

.bi-table-wrapper { overflow-x: auto; max-width: 100%; } .bi-table { width: 100%; min-width: 700px; border-collapse: collapse; margin: auto; background-color: #fff; color: black; box-shadow: 0 0 10px rgba(0,0,0,0.1); } .bi-table caption { caption-side: top; font-size: 1.6rem; font-weight: bold; padding: 1rem; color: #00897F; text-align: center; } .bi-table th, .bi-table td { padding: 12px 20px; text-align: center; border-bottom: 1px solid #ddd; } .bi-table th { background-color: #00897F; color: white; } .bi-table tr:hover { background-color: #f1f1f1; } .bi-table tbody tr:nth-child(even) { background-color: #f9f9f9; } @media (max-width: 600px) { .bi-table { min-width: 100%; } .bi-table caption { font-size: 1.2rem; padding: 0.75rem; } .bi-table th, .bi-table td { padding: 8px 10px; font-size: 0.9rem; } }
Metric Estimated Investment
Licensing Cost $300 to $5,000+ per month depending on SKU
Initial Setup Time 2 to 4 weeks for core infrastructure
Migration Effort 3 to 6 months for full transition
Training Needs 20 to 40 hours for key IT staff

The table above illustrates the typical investment required for a mid-sized business transitioning to Fabric. While the monthly licensing fee varies based on the chosen capacity, the initial setup is relatively quick compared to legacy systems. Your team should plan for a few months of migration work to move all existing assets.

SQL Server vs Fabric Capacity

The real-world difference between these two models lies in how you manage your resources. SQL Server licensing is often rigid and tied to specific hardware or virtual machines. Fabric F-SKUs provide a pool of compute power that can be paused or scaled up and down based on your actual usage during the day.

.bi-table-wrapper { overflow-x: auto; max-width: 100%; } .bi-table { width: 100%; min-width: 700px; border-collapse: collapse; margin: auto; background-color: #fff; color: black; box-shadow: 0 0 10px rgba(0,0,0,0.1); } .bi-table caption { caption-side: top; font-size: 1.6rem; font-weight: bold; padding: 1rem; color: #00897F; text-align: center; } .bi-table th, .bi-table td { padding: 12px 20px; text-align: center; border-bottom: 1px solid #ddd; } .bi-table th { background-color: #00897F; color: white; } .bi-table tr:hover { background-color: #f1f1f1; } .bi-table tbody tr:nth-child(even) { background-color: #f9f9f9; } @media (max-width: 600px) { .bi-table { min-width: 100%; } .bi-table caption { font-size: 1.2rem; padding: 0.75rem; } .bi-table th, .bi-table td { padding: 8px 10px; font-size: 0.9rem; } }
Feature Azure SQL Server Microsoft Fabric (F-SKUs)
Scaling Manual or limited auto-scale Smooth scaling with "Bursting"
Pricing Model Per core or DTU Capacity-based (F-SKUs)
Management Server-heavy SaaS / Low-maintenance
Integration Disconnected tools Fully unified ecosystem

Comparing traditional SQL licensing with Fabric shows a clear move toward flexibility. F-SKUs allow you to pay for what you use, which is ideal for businesses with fluctuating data workloads. This shift removes the need for your IT team to constantly monitor server loads and manually adjust resources.

Finding the Sweet Spot SKU

For most mid-sized businesses, the F64 SKU is considered the sweet spot because it includes the Power BI Free user capability. This means you don’t have to buy individual Pro licenses for every person who only needs to view reports. You can find more details on these enterprise licenses to see which fits your specific headcount and data volume.

.bi-table-wrapper { overflow-x: auto; max-width: 100%; } .bi-table { width: 100%; min-width: 700px; border-collapse: collapse; margin: auto; background-color: #fff; color: black; box-shadow: 0 0 10px rgba(0,0,0,0.1); } .bi-table caption { caption-side: top; font-size: 1.6rem; font-weight: bold; padding: 1rem; color: #00897F; text-align: center; } .bi-table th, .bi-table td { padding: 12px 20px; text-align: center; border-bottom: 1px solid #ddd; } .bi-table th { background-color: #00897F; color: white; } .bi-table tr:hover { background-color: #f1f1f1; } .bi-table tbody tr:nth-child(even) { background-color: #f9f9f9; } @media (max-width: 600px) { .bi-table { min-width: 100%; } .bi-table caption { font-size: 1.2rem; padding: 0.75rem; } .bi-table th, .bi-table td { padding: 8px 10px; font-size: 0.9rem; } }
Business Size Recommended SKU Key Benefit
Small (1-50 users) F2 to F8 Low entry cost for basic needs
Mid-Market (50-250 users) F32 to F64 Includes Power BI Free viewer rights
Large (250+ users) F128 and above High performance for massive data

Selecting the right SKU is a balance between performance needs and budget constraints. The F64 level is particularly popular because it simplifies the licensing headache for the entire company. It allows you to provide data access to everyone without a massive increase in per-user costs.

Production Environment Timeline

Standing up your top 3 reports in a production environment should not take months if you have a clear plan. With the latest March 2026 feature summary, new automation tools make the process even faster. A lean team can often see results in as little as six weeks if they focus on their most critical data assets first.

.bi-table-wrapper { overflow-x: auto; max-width: 100%; } .bi-table { width: 100%; min-width: 700px; border-collapse: collapse; margin: auto; background-color: #fff; color: black; box-shadow: 0 0 10px rgba(0,0,0,0.1); } .bi-table caption { caption-side: top; font-size: 1.6rem; font-weight: bold; padding: 1rem; color: #00897F; text-align: center; } .bi-table th, .bi-table td { padding: 12px 20px; text-align: center; border-bottom: 1px solid #ddd; } .bi-table th { background-color: #00897F; color: white; } .bi-table tr:hover { background-color: #f1f1f1; } .bi-table tbody tr:nth-child(even) { background-color: #f9f9f9; } @media (max-width: 600px) { .bi-table { min-width: 100%; } .bi-table caption { font-size: 1.2rem; padding: 0.75rem; } .bi-table th, .bi-table td { padding: 8px 10px; font-size: 0.9rem; } }
Phase Task Duration
Phase 1 OneLake Setup and Security 1 Week
Phase 2 Data Ingestion and Shortcuts 2 Weeks
Phase 3 Report Development and Testing 3 Weeks

This timeline shows that a production environment can be achieved relatively quickly. By focusing on a small number of high-value reports, your team can demonstrate immediate success to the leadership team. This builds the trust necessary to continue with the rest of the migration project over time.

Three Non-Negotiable Success Steps

Success in a migration project is never an accident; it’s the result of a disciplined approach. You must evaluate your current tech stack honestly and engage with your stakeholders early. Following a structured migration guide will help you avoid the common pitfalls that cause many data projects to fail.

.bi-table-wrapper { overflow-x: auto; max-width: 100%; } .bi-table { width: 100%; min-width: 700px; border-collapse: collapse; margin: auto; background-color: #fff; color: black; box-shadow: 0 0 10px rgba(0,0,0,0.1); } .bi-table caption { caption-side: top; font-size: 1.6rem; font-weight: bold; padding: 1rem; color: #00897F; text-align: center; } .bi-table th, .bi-table td { padding: 12px 20px; text-align: center; border-bottom: 1px solid #ddd; } .bi-table th { background-color: #00897F; color: white; } .bi-table tr:hover { background-color: #f1f1f1; } .bi-table tbody tr:nth-child(even) { background-color: #f9f9f9; } @media (max-width: 600px) { .bi-table { min-width: 100%; } .bi-table caption { font-size: 1.2rem; padding: 0.75rem; } .bi-table th, .bi-table td { padding: 8px 10px; font-size: 0.9rem; } }
Step Action Objective
Step 1 Audit Existing Data Kill legacy systems and clean data
Step 2 Define Business Value Map reports to specific revenue goals
Step 3 Pilot Small Prove the concept with one department

Where Do You Go From Here?

Modernizing your data infrastructure is a massive undertaking, but it’s the only way to stay competitive. Moving from Azure SQL to Microsoft Fabric gives your lean IT team the tools they need to act like a much larger department. By consolidating your stack into OneLake, you eliminate silos and reduce the constant fire-fighting that usually plagues small teams.

Fortune Favors the Bold

Your role as an IT leader is to provide insights that drive the business forward, not to just manage servers. Fabric allows you to step into that strategic role by automating the tedious parts of data management. When you finally trust your data, your efficiency will shoot through the roof and your team will become a hero in the eyes of your CEO.

  • Take Action Now

    Don’t let your data continue to sit in disconnected silos where it gathers dust and creates confusion. Start by picking one legacy system that is causing the most pain and plan its move to the new platform. Every small win builds the momentum you need to transform your entire organization into a data-driven powerhouse that makes decisions with total clarity.

  • Fortune Favors the Bold

    Your role as an IT leader is to provide insights that drive the business forward, not to just manage servers. Fabric allows you to step into that strategic role by automating the tedious parts of data management. When you finally trust your data, your efficiency will shoot through the roof and your team will become a hero in the eyes of your CEO.

Get Expert Help From a Trusted Microsoft Fabric Consultant

If you feel overwhelmed by the technical details or the licensing options, you don’t have to do this alone. Allston Yale is a leading Microsoft Fabric consultant that specializes in helping businesses navigate these complex transitions without the usual headaches or budget overruns. Take the first step toward data clarity and book a free data check up with us today!

Sources

How Do You Pick the Right Microsoft Fabric SKU

How Do You Pick the Right Microsoft Fabric SKU For Your Business?

Choosing the right Microsoft Fabric SKU involves matching your specific workload requirements to the available Capacity Units while utilizing trial periods to gauge actual consumption. Smaller organizations must start with lower tiers and scale up as data demands grow to ensure that they maintain budget control.

Allston Yale Serves Businesses in Texas and across the USA

  • The Scalability Secret

    The secret to success lies in monitoring your usage patterns during the initial deployment phase to avoid paying for idle resources. By leveraging the pause and resume features found in certain tiers, you can effectively manage your monthly spend while still providing your team with powerful analytics tools.

  • Leveraging Expert Advice

    Navigating these choices requires a deep understanding of how different workloads impact performance across the entire environment. A comprehensive sizing guide can help explain the nuances of capacity management for modern organizations.

  • Avoiding Hidden Fees

    It’s only natural to worry about hidden fees or complicated billing structures that could disrupt your financial planning. By focusing on a structured approach to capacity, you can eliminate surprises and ensure that your data infrastructure remains a strategic asset rather than a significant financial burden.

  • A Collaborative Effort

    Success with this platform requires collaboration between IT teams and business stakeholders to align technical capabilities with real world needs. When everyone understands the cost implications of their data requests, the organization can move toward a data first culture that values efficiency.

The High Cost of Misalignment

Most businesses feel a deep sense of anxiety when transitioning from fixed licensing to a consumption-based model like Microsoft Fabric. This fear often stems from historical experiences where cloud costs spiraled out of control due to a lack of visibility into how data processing actually affects the bottom line.

  • The Overspending Trap

    If you purchase an SKU that is far too expensive for your current needs, you are effectively throwing capital away that could be used for growth. This mistake can lead to friction with financial leaders and make it harder to justify future investments in advanced analytics or other critical digital transformations.

  • The Feature Gap

    Conversely, selecting an SKU that lacks the necessary features can paralyze your operations and leave your team without the tools they need. Some lower tiers do not support advanced capabilities like Copilot or certain governance features, which might be essential for your specific industry requirements.

  • Erosion Of Profit Margins

    As we see in many industries, disjointed data systems and poor planning can eat into annual profits. When your capacity is not properly sized, you might experience project delays or missed opportunities because your insights are not available in a timely or cost-effective manner.

  • Loss Of Competitive Edge

    Organizations that fail to get their data infrastructure right often find themselves falling behind their faster competitors. If your team is constantly fighting with a system that is either too slow or too costly, they cannot focus on the strategic decisions that drive real market value.

  • Building Trust In Data

    Trust is the foundation of any data driven company, and inconsistent performance due to poor SKU selection can destroy that trust quickly. When dashboards are slow or unavailable because the capacity is throttled, stakeholders will return to using their manual and unreliable spreadsheets.

  • Strategic Budget Allocation

    You can learn more about how to choose the right SKU by analyzing your specific needs through a detailed estimator guide. Proper planning allows you to allocate your budget strategically, ensuring every dollar delivers maximum value.

  • Eliminating Bill Shock

    The ultimate goal is to eliminate the bill shock that haunts many IT managers during their first year of cloud migration. By understanding the relationship between workload and capacity, you can create a predictable financial roadmap that supports long term organizational stability and growth.

Interpreting Microsoft Fabric’s SKU Tiers

.bi-table-wrapper { overflow-x: auto; max-width: 100%; } .bi-table { width: 100%; min-width: 700px; border-collapse: collapse; margin: auto; background-color: #fff; color: black; box-shadow: 0 0 10px rgba(0,0,0,0.1); } .bi-table caption { caption-side: top; font-size: 1.6rem; font-weight: bold; padding: 1rem; color: #00897F; text-align: center; } .bi-table th, .bi-table td { padding: 12px 20px; text-align: center; border-bottom: 1px solid #ddd; } .bi-table th { background-color: #00897F; color: white; } .bi-table tr:hover { background-color: #f1f1f1; } .bi-table tbody tr:nth-child(even) { background-color: #f9f9f9; } @media (max-width: 600px) { .bi-table { min-width: 100%; } .bi-table caption { font-size: 1.2rem; padding: 0.75rem; } .bi-table th, .bi-table td { padding: 8px 10px; font-size: 0.9rem; } }
SKU Tier Capacity Units (CU) Key Inclusions & Features Best For
F2 - F4 2 - 4 CU Basic OneLake, Data Factory, Data Engineering Small POCs, individual testing
F8 - F16 8 - 16 CU Advanced Data Warehousing, Real-Time Intelligence Small team departmental analytics
F32 32 CU Increased concurrency, Mid-tier processing Growing SMBs with multiple users
F64 64 CU Power BI Free User viewing enabled, Full Copilot Medium enterprises, broad consumption
F128+ 128+ CU Maximum throughput, dedicated enterprise support Large scale data powerhouse needs

This table provides a high-level overview of how various Microsoft Fabric SKUs compare in terms of capacity units and typical use cases. It is a helpful reference for leaders who need to make quick decisions about which tier might be the most appropriate starting point for their firm. Starting with an F2 or F4 is often the best move for small teams, while larger organizations should look toward F64 and above to unlock full enterprise features.

Navigating Microsoft Fabric’s SKUs

To navigate the landscape of Microsoft Fabric, you must understand the distinction between various SKUs and how they align with your business goals. There are several options ranging from small entry level tiers to massive enterprise capacities, each offering a specific number of Capacity Units for your tasks.

  • Harnessing The Estimator

    One of the most powerful tools at your disposal is the official Fabric capacity estimator provided by Microsoft. This tool allows you to input your expected usage patterns and receive a recommendation on which tier will best support your operational needs.

  • Entry Level Capacities

    The lower tiers are perfect for small teams that are beginning their data journey and do not require heavy processing power immediately. These SKUs offer a cost-effective way to test the waters and build out initial dashboards without committing to a massive monthly expenditure right away.

  • Mid-Range Performance

    As your data volume grows, you will likely need to move into the mid-range SKUs that provide more robust processing capabilities. These tiers offer a balance between price and performance, allowing for more complex data engineering tasks and larger volumes of concurrent users across the company.

  • Enterprise Grade Tiers

    For large organizations with massive datasets and high demand for real time insights, the upper tiers are the only viable solution. These capacities provide the highest level of performance and include every advanced feature available, ensuring that your data powerhouse never experiences any lag.

  • Managing Performance Fluctuations

    Understanding how to maintain budget control is essential when dealing with the dynamic nature of capacity performance. It is important to monitor how your tasks consume Capacity Units over time so that you can make informed adjustments to your tier selection.

  • Smoothing And Bursting

    Fabric uses a concept called smoothing to handle peaks in activity by spreading the workload over a longer period of time. This feature is a nifty little thing that helps prevent your capacity from being throttled during busy hours, which keeps your reports running smoothly for everyone.

  • The Power Of OneLake

    All SKUs benefit from the unified storage of OneLake, which simplifies data management by keeping everything in a single location. This approach reduces the need for expensive data movement and allows different teams to collaborate on the same datasets without creating redundant copies of information.

  • Scaling With Confidence

    The ability to scale your capacity up or down as needed provides a level of flexibility that was previously unavailable in legacy systems. This means you can increase your power during peak seasons and decrease it during slower months, keeping your costs perfectly aligned with your activity.

  • Optimizing Your Investment

    Regularly reviewing your capacity metrics is a game changing habit that ensures you are not overpaying for unused power. By staying proactive and making data driven adjustments to your SKU, you can maximize the return on your investment while providing top tier analytics for your team.

Move Forward With Confidence

Mastering the art of capacity planning is a journey that requires patience, observation, and a willingness to adapt as your company evolves. By choosing the right SKU from the start, you set a strong foundation for a data first culture that prioritizes both technological excellence and financial responsibility.

  • The Path To Clarity

    Turning data chaos into clarity is only possible when you have a predictable and reliable infrastructure supporting your strategic moves. When you eliminate the fear of bill shock, you can focus on asking the deeper questions that lead to genuine problem solving and massive organizational wins.

  • A Sustainable Future

    Your commitment to becoming a data driven powerhouse will pay off through increased efficiency and a sharper competitive edge in your market. As you continue to refine your approach to Microsoft Fabric, you will find that data becomes your biggest ally in achieving your long-term goals.

  • Building A Strong Foundation

    Remember that every step you take toward better capacity management is an investment in the future of your organization and its people. By treating your data infrastructure with the care it deserves, you ensure that your team always has the insights they need to succeed every single day.

Your Partner for Your Next Strategic Move

If you are still feeling uncertain about which path to take, Allston Yale's Microsoft Fabric consultancy services can help you navigate these complex technical waters. Give us a call or book a free data check up so we can help you turn your data into a truly game-changing strategic asset.

Sources

How Much Does It Cost to Migrate to Microsoft Fabric

How Much Does It Cost to Migrate to Microsoft Fabric?

Determining the total cost of a migration to Microsoft Fabric involves looking at more than just the monthly subscription fees for cloud capacity. Most businesses should plan for an initial investment that covers licensing, data engineering labor, and the decommissioning of legacy data warehouse tools.

Allston Yale Serves Businesses in Texas and across the USA

  • Initial Infrastructure Outlay

    The foundation of your spending begins with the capacity reservation you choose, which can be paid for on an hourly basis or through a yearly commitment. Small teams often start with an F2 SKU to test the waters while they are getting started with their modernization journey.

  • Engineering And Labor Costs

    Beyond the software itself, the most significant expense is often the human capital required to move data pipelines from old systems into the new OneLake. You must budget for architects who understand how to translate legacy SQL scripts or messy BIM models into clean, parquet-based delta tables for analytics.

  • Data Storage And Networking

    OneLake storage costs are generally low but they are separate from the compute capacity you purchase to run your daily reports and transformations. These storage fees are billed based on the amount of data you keep in the lake and any networking egress charges incurred if data moves outside the Azure region.

  • Long Term Operational Spend

    Once the migration is complete, your costs shift toward optimization and governance to ensure that you are not overpaying for idle compute power. Ongoing maintenance includes monitoring capacity usage and scaling up or down based on the actual demand of your business users during peak reporting periods each month.

  • Total Cost Ownership View

    In summary, a mid-sized organization can expect to spend between thirty thousand and one hundred thousand dollars on a complete migration project. This range covers the professional services for implementation as well as the first year of Fabric capacity fees, assuming a standard volume of enterprise data.

Why Migrating to Microsoft Fabric is a Strategic Necessity

Migrating to a unified environment is about more than just technology; it is about survival in a market where fragmented data is a silent profit killer. Many firms lose significant margins because their design teams use siloed models that never reach the finance department or the procurement team in time.

  • Breaking Down Data Silos

    When you unify your engineering, storage, and visualization into a single workspace, you eliminate the need to juggle multiple expensive vendors. You no longer need to pay for Snowflake for storage while also maintaining Databricks for engineering and Tableau for your visual reporting dashboards every month.

  • Improving Team Efficiency

    A unified platform allows your lean IT teams to stop acting like manual laborers who move data between disconnected systems all day long. By adopting a centralized architecture, your employees can focus on solving business problems rather than fixing broken pipelines or troubleshooting login errors.

  • Real Time Business Insights

    Fabric offers a feature called Direct Lake that allows your reports to access raw data in darn-near-real-time without the need for slow refreshes. This capability is game-changing for leaders who need to see material cost spikes or project overruns the moment they happen rather than three weeks after the fact.

  • Simplification of the Stack

    If your organization is already using Microsoft 365 or Dynamics 365, the integration is seamless and requires far less custom code than other platforms. The ecosystem is designed to play nicely with SharePoint and Teams, making your data easily accessible to the people who actually make the big daily decisions.

  • Cost Predictability and Control

    Managing costs across several cloud vendors is a nightmare for any CIO who wants to keep a close eye on their annual technology budget. Fabric simplifies this by providing a single bill for all your data needs, allowing you to compare it directly against other major cloud providers like Google.

Feature Comparison of Top Data Platforms

.bi-table-wrapper { overflow-x: auto; max-width: 100%; } .bi-table { width: 100%; min-width: 700px; border-collapse: collapse; margin: auto; background-color: #fff; color: black; box-shadow: 0 0 10px rgba(0,0,0,0.1); } .bi-table caption { caption-side: top; font-size: 1.6rem; font-weight: bold; padding: 1rem; color: #00897F; text-align: center; } .bi-table th, .bi-table td { padding: 12px 20px; text-align: center; border-bottom: 1px solid #ddd; } .bi-table th { background-color: #00897F; color: white; } .bi-table tr:hover { background-color: #f1f1f1; } .bi-table tbody tr:nth-child(even) { background-color: #f9f9f9; } @media (max-width: 600px) { .bi-table { min-width: 100%; } .bi-table caption { font-size: 1.2rem; padding: 0.75rem; } .bi-table th, .bi-table td { padding: 8px 10px; font-size: 0.9rem; } }
Feature Microsoft Fabric Snowflake Databricks Google BigQuery
Primary Architecture SaaS Unified Lakehouse Data Warehouse Data Intelligence Serverless Warehouse
Storage Format Open Parquet/Delta Proprietary Open Delta Lake Proprietary/Open
Integration Native M365/Power BI Third-party Connectors High Manual Config Native Google Cloud
User Experience Low Code/No Code SQL Centric Notebook/Developer SQL/Console
Copilot AI Integrated Native Snowflake Cortex Mosaic AI Duet AI

The table highlights how Fabric provides a more integrated experience for organizations that are already heavily invested in the Microsoft software ecosystem. While competitors like Databricks offer high performance for developers, Fabric focuses on lowering the barrier to entry for business users and small IT teams. Comparing these tools shows that the choice often comes down to how much manual engineering your current team is actually capable of handling.

  • Leveraging Existing Licensing

    Many organizations do not realize that they already have access to certain Fabric features through their existing Microsoft 365 E5 licenses today. This reduces the total cost of migration because you are not starting from zero; you are simply activating and scaling resources that are already within your reach.

  • Eliminating Technical Debt

    Old legacy systems are like a house of cards that can collapse with one gust of wind, leading to massive project assessment risks. By moving to a modern platform, you kill the legacy systems that cause manual entry errors and keep your business intelligence trapped in static, useless PDF documents or spreadsheets.

  • Cultivating a Data Culture

    When tools are intuitive and easy to use, team members are more likely to actually live and breathe the data in their daily operations. This shift turns resistant employees into data advocates who rely on dashboards to make massive strategic moves that shoot the company's efficiency right through the roof quickly.

  • Scalability for Growth

    A robust data management system should be able to grow with your organization's needs without requiring a total overhaul every two years. Fabric's capacity model allows you to start small and scale up smoothly as your data volume increases, ensuring your infrastructure is never an obstacle to your success.

  • Rock Solid Governance

    Establishing strong policies for data quality and security is much easier when all your assets reside in a single, governed environment like OneLake. This builds deep trust in the numbers, ensuring that every department is looking at the same version of the truth when they are collaborating on projects.

  • Faster Time to Market

    Companies that rely on manual workflows are significantly slower to react to market changes than their data-driven competitors in any industry. Modernizing your stack cuts down processing times from days to minutes, allowing you to price client bids with historical insights that ensure your margins stay healthy and safe.

  • Empowering Lean IT Teams

    If you only have a small IT team, they have to be like supermen to handle security, support, and complex data analytics all at once. Fabric reduces the burden on these individuals by automating many of the infrastructure tasks that used to take up the majority of their productive working hours every week.

Costs, Planning, and Implementation Timelines

Planning for a migration requires a clear roadmap that accounts for the specific SKUs you will need and the time it takes to build. You cannot simply flip a switch and expect your reports to work; you need to understand the current pricing guide to avoid any surprise bills at the end of the first month.

Budgeting for Migration Costs

.bi-table-wrapper { overflow-x: auto; max-width: 100%; } .bi-table { width: 100%; min-width: 700px; border-collapse: collapse; margin: auto; background-color: #fff; color: black; box-shadow: 0 0 10px rgba(0,0,0,0.1); } .bi-table caption { caption-side: top; font-size: 1.6rem; font-weight: bold; padding: 1rem; color: #00897F; text-align: center; } .bi-table th, .bi-table td { padding: 12px 20px; text-align: center; border-bottom: 1px solid #ddd; } .bi-table th { background-color: #00897F; color: white; } .bi-table tr:hover { background-color: #f1f1f1; } .bi-table tbody tr:nth-child(even) { background-color: #f9f9f9; } @media (max-width: 600px) { .bi-table { min-width: 100%; } .bi-table caption { font-size: 1.2rem; padding: 0.75rem; } .bi-table th, .bi-table td { padding: 8px 10px; font-size: 0.9rem; } }
Expense Category Estimated Cost (Small) Estimated Cost (Mid) Description of Cost
Monthly Capacity $300 - $800 $1,500 - $5,000 Recurring Azure compute fees (F-SKUs)
Storage (OneLake) $20 - $100 $200 - $1,000 Billed per GB of data stored in Azure
Initial Implementation $15,000 - $25,000 $40,000 - $80,000 Consulting and engineering labor fees
Training & Adoption $2,000 - $5,000 $5,000 - $15,000 Internal workshops and team upskilling

Budgeting for a migration involves balancing the recurring monthly capacity fees with the one-time labor costs required to build your foundation. Small organizations can often get away with lower-tier SKUs and minimal consulting, while mid-sized firms need to invest more in engineering to handle complex data sets. It is vital to review the pricing details carefully to ensure that your estimated compute needs align with your actual budget.

Factors for Selecting the Right Microsoft Fabric SKU

.bi-table-wrapper { overflow-x: auto; max-width: 100%; } .bi-table { width: 100%; min-width: 700px; border-collapse: collapse; margin: auto; background-color: #fff; color: black; box-shadow: 0 0 10px rgba(0,0,0,0.1); } .bi-table caption { caption-side: top; font-size: 1.6rem; font-weight: bold; padding: 1rem; color: #00897F; text-align: center; } .bi-table th, .bi-table td { padding: 12px 20px; text-align: center; border-bottom: 1px solid #ddd; } .bi-table th { background-color: #00897F; color: white; } .bi-table tr:hover { background-color: #f1f1f1; } .bi-table tbody tr:nth-child(even) { background-color: #f9f9f9; } @media (max-width: 600px) { .bi-table { min-width: 100%; } .bi-table caption { font-size: 1.2rem; padding: 0.75rem; } .bi-table th, .bi-table td { padding: 8px 10px; font-size: 0.9rem; } }
Selection Factor Priority Impact on SKU Choice
Concurrent Users High More users require higher compute power (CU)
Data Refresh Rate Medium Frequent refreshes need more background capacity
AI/Copilot Usage High Copilot requires at least an F64 SKU to run
Complexity of Logic Medium Complex DAX or Spark jobs need more memory

Selecting the right SKU is a critical decision that depends on how many people will be using the reports and the complexity of your data. If you want to use advanced AI features, you must be prepared to commit to a higher tier, as these tools are not available on the smaller, entry-level capacities. Using a capacity estimator tool can help you visualize these needs before you make a final purchase decision.

Production Timeline for Top 3 Reports

.bi-table-wrapper { overflow-x: auto; max-width: 100%; } .bi-table { width: 100%; min-width: 700px; border-collapse: collapse; margin: auto; background-color: #fff; color: black; box-shadow: 0 0 10px rgba(0,0,0,0.1); } .bi-table caption { caption-side: top; font-size: 1.6rem; font-weight: bold; padding: 1rem; color: #00897F; text-align: center; } .bi-table th, .bi-table td { padding: 12px 20px; text-align: center; border-bottom: 1px solid #ddd; } .bi-table th { background-color: #00897F; color: white; } .bi-table tr:hover { background-color: #f1f1f1; } .bi-table tbody tr:nth-child(even) { background-color: #f9f9f9; } @media (max-width: 600px) { .bi-table { min-width: 100%; } .bi-table caption { font-size: 1.2rem; padding: 0.75rem; } .bi-table th, .bi-table td { padding: 8px 10px; font-size: 0.9rem; } }
Phase Duration Activities
Environment Setup 1 Week Tenant settings, security, and OneLake setup
Data Ingestion 2 - 3 Weeks Connecting sources and building pipelines
Report Development 2 Weeks Building the top 3 high-impact dashboards
Testing & UAT 1 Week User feedback and data validation checks

Standing up a production environment for your most important reports usually takes between six to eight weeks of focused effort by an expert team. This timeframe ensures that the data is accurate, the security is tight, and the stakeholders actually trust the insights they are seeing on their screens. You can often start with a free trial account to begin the ingestion process without incurring any immediate software costs.

  • Monitoring Recent Feature Updates

    Microsoft releases updates for the Fabric platform at a very rapid pace, which can impact how you plan your long-term migration strategy. Staying informed about the latest feature summaries allows your team to take advantage of new automation tools that can reduce your overall engineering costs.

  • Assessing New Capabilities

    As the platform evolves, new ways to save money and improve performance are introduced almost every month by the product development team. It is essential to keep an eye on what is new in the ecosystem so you do not spend time building manual solutions for problems that Microsoft has already automated.

  • The Role of Stakeholder Engagement

    Success in a migration project depends heavily on getting the right people involved in the process from the very first day of planning. You must understand what problems your stakeholders are trying to solve and what they want from their data before you write a single line of code or move a single table.

  • Setting Realistic Milestones

    Do not promise rapid transformations that you cannot deliver; instead, communicate the timeline and potential hurdles with total honesty. Developing a clear roadmap with milestones allows your leadership to track progress even if the changes feel gradual during the first few weeks of the project.

  • Analyzing Previous Failures

    Before you start a new migration, take the time to dig into why your previous data projects might have failed or been ignored by staff. Understanding these root causes can prevent you from repeating the same mistakes and will provide a much clearer path toward a successful and lasting implementation.

  • Communicating Quick Wins

    As you start achieving tangible results with your first few reports, share these successes with your leadership team immediately. Highlighting progress builds trust and demonstrates your commitment to providing actionable insights that help the business outclass and outcompete every one of its rivals.

  • Ensuring Executive Support

    Lastly, ensure that your leadership is genuinely supportive of becoming a data-driven organization before you commit to a large budget. Their commitment is vital for securing the resources and unblocking the technical or political challenges you may encounter as you modernize your data stack.

  • Avoiding the One-Off Report Trap

    Do not let your team become average developers who blindly take requests and build ninety-nine problems worth of useless, one-off reports. Encourage them to ask deeper questions about how the data will be used in daily processes so that every dashboard you build provides genuine business value to the firm.

Taking the Next Steps for Your Data Strategy

Migrating to Microsoft Fabric is a major undertaking that requires a blend of technical expertise and a deep understanding of your business objectives. By focusing on a unified architecture, you can turn your disorganized data into a powerhouse that drives every single strategic move your company makes.

  • The Value of Clear Direction

    When you have a structured approach and a clear understanding of the costs, you can navigate the complex landscape of changing technology with confidence. Turning a chaotic data infrastructure into a strategic asset is not just a dream; it is a reality for firms that are willing to invest in their future.

  • Building a Trusted Foundation

    People must be able to trust the information they see in their dashboards so that they can learn something new every time they visit the platform. A well-governed and high-performing environment ensures that your data remains a major ally rather than a tough obstacle to your daily operations and growth.

  • Final Thoughts on Migration

    While the initial costs and timelines may seem daunting, the long-term efficiency and profit protection provided by Microsoft Fabric are absolutely game-changing. Stop letting your data sit in Excel hell and start leveraging a platform that is designed to help your team work together more effectively.

Take the First Step With a Microsoft Fabric Consultancy

If you are ready to stop guessing about your data and want to see how a unified architecture can transform your bottom line, Allston Yale is here to help. We are a trusted Microsoft Fabric consultancy who cares about your success. Book a free data check-up with us today!

Sources

How Much is Manual Reporting Costing My Business?

How Much is Manual Reporting Costing My Business in Lost Revenue?

Poor data quality is a silent profit killer that causes businesses to lose millions annually through bad decisions and wasted labor. Manual reporting errors compound over time, creating a "house of cards" where one mistake leads to a massive financial collapse across the entire organization.

Allston Yale Serves Businesses in Texas and across the USA

Why Your Data Is a House of Cards

Most leaders realize that manual spreadsheets are messy, but few calculate the actual erosion of their margins. When your team spends hours fixing typos instead of analyzing trends, you are burning capital. Fragmented systems and stale data ensure that your strategic moves are based on fiction rather than fact.

Why Bad Data is Your Toughest Obstacle

In my experience, many organizations treat data analytics as a cost center rather than a strategic asset. This mindset is dangerous because the pain points felt by stakeholders—like budget overruns and missed bids—are direct symptoms of data silos and manual entry errors that hide the truth from the C-Suite.

  • The Friction of Fragmented Systems

    Bouncing around different vendors to juggle costs is a massive pain that leads to disconnected insights. When design teams, procurement, and finance all work from different versions of the truth, you end up with 15% budget overruns from rework. This chaos makes it impossible to move at the speed of the market.

  • Trust as the Foundation of Analytics

    People must be able to trust the information to actually live and breathe a data-first culture. If your risk dashboard is still a PDF or a static report, you are already weeks too late to spot a spike in material costs. High-fidelity data is essential for survival in a competitive landscape today.

  • The High Price of "Excel Hell"

    Relying on spreadsheets means your most expensive employees are acting as human data pipelines. This manual labor isn't free; it is a significant drain on efficiency that keeps your team from doing high-value work. Every hour spent on a manual report is an hour lost to outclassing your competitors.

  • Identifying the Silent Profit Killer

    Industry data reveals that mid-sized firms lose nearly 12% in annual profits due to delayed decisions. These consequences are often invisible until you analyze past failures. Identifying the root cause of these losses is the first step toward turning a chaotic infrastructure into a strategic powerhouse.

  • Shifting the Conversation to Value

    We need to change how we talk to leadership about the cost of poor data quality. It is not about buying fancy new tech; it is about protecting the bottom line. Accurate analytics give you the confidence to make massive strategic moves that shoot your efficiency through the roof.

Solving the Data Crisis

To stop the bleeding, you must move away from manual processes and embrace scalable infrastructure like Microsoft Fabric or Power BI. These tools integrate your ecosystem, making the data easily available and accessible. Killing one legacy system this quarter can start your journey toward near-real-time clarity.

  • Integrating the Modern Data Stack

    Fabric allows you to get it all in one place, which helps bypass traditional data ownership models. By using automated data pipelines, you make the tedious manual engineering work obsolete. This shift ensures that your data serves the people, providing actionable insights instead of just more noise.

  • Implementing Robust Data Governance

    Establishing rock-solid policies for data quality and compliance builds super strong trust. You can leverage tools to improve data quality stats and ensure that every team member is working from the same source of truth. Governance is the backbone that prevents your infrastructure from feeling like a house of cards.

Manual vs. Modern: The Breakdown

.bi-table-wrapper { overflow-x: auto; max-width: 100%; } .bi-table { width: 100%; min-width: 700px; border-collapse: collapse; margin: auto; background-color: #fff; color: black; box-shadow: 0 0 10px rgba(0,0,0,0.1); } .bi-table caption { caption-side: top; font-size: 1.6rem; font-weight: bold; padding: 1rem; color: #00897F; text-align: center; } .bi-table th, .bi-table td { padding: 12px 20px; text-align: center; border-bottom: 1px solid #ddd; } .bi-table th { background-color: #00897F; color: white; } .bi-table tr:hover { background-color: #f1f1f1; } .bi-table tbody tr:nth-child(even) { background-color: #f9f9f9; } @media (max-width: 600px) { .bi-table { min-width: 100%; } .bi-table caption { font-size: 1.2rem; padding: 0.75rem; } .bi-table th, .bi-table td { padding: 8px 10px; font-size: 0.9rem; } }
Feature Manual Reporting (Spreadsheets) Modern Data Analytics (Power BI/Fabric)
Data Latency Days or weeks to compile Darn-near-real-time (DNRT)
Error Risk Extremely high due to human entry Low via automated validation
Scalability Hard to maintain as data grows Built to grow with the organization
Accessibility Siloed in local files or emails Centralized in a single workspace

The table above highlights how manual reporting is a bottleneck that creates project risks through slow assessments. Modern tools offer real-time dashboards and automated flows that eliminate the "hidden costs" of manual labor. Transitioning to these features allows your organization to become a data-driven powerhouse.

Survival of the Data-Driven

Modernizing your stack can cut processing time from days to minutes. Firms stuck in manual workflows are significantly slower to market than their peers. Understanding the hidden costs of your current state is vital for securing the resources needed to unblock these challenges and thrive.

Turning Data Chaos into Clarity

Transforming your organization is a massive undertaking, but the cost of inaction is far higher. By cultivating a data-first culture and investing in the right tools, you can turn data chaos into a competitive advantage. The goal is to move from "Excel hell" to a future where data drives every strategic move.

Stop Taking Blind Requests

The average leader takes requests blindly while ignoring the underlying data rot. Visionaries ask deeper questions about their processes and look for ways to break down silos. When your team finally trusts their data, they will have the power to uncover trends and inform proactive decision-making.

If you are tired of wondering if your reports are lying to you, let's get serious about a solution. We are a Power BI & Microsoft Fabric consultancy that is passionate about helping firms find clarity in their numbers. You can book a free data check up with Allston Yale

Sources

How to Migrate Your Business from Databricks to Microsoft Fabric

How to Migrate Your Business from Databricks to Microsoft Fabric

Migrating from Databricks to Microsoft Fabric is essentially a move toward extreme operational simplicity. For a lean IT team, this transition means reducing the administrative burden of managing complex spark clusters and disparate vendors. You move from being the data plumber to being a true business problem solver.

Allston Yale Serves Businesses in Texas and across the USA

  • Consolidating Your Data Storage

    One of the biggest advantages is bringing everything into a single software-as-a-service layer. This eliminates the friction of moving data between different storage tools and compute environments. When your data lives in one place, your team can finally focus on providing insights rather than just managing silos.

  • Reducing Architectural Complexity

    In many organizations, the IT lead is a Superman who manages everything from security to analytics. Fabric simplifies this by offering a unified workspace where engineering and visualization coexist. This reduces the need for specialized engineering talent, which is a massive win for smaller, agile teams.

  • Accelerating Real-Time Insights

    By utilizing specific connection shortcuts, you can access your raw information in darn-near-real-time. This allows your business leaders to make decisions based on what is happening right now, not last week. It’s about removing the lag that usually exists between data generation and business action.

  • Leveraging Existing Skill Sets

    Your team doesn't need to learn an entirely new language to make this move successful. Because the platform integrates so deeply with tools you already know, like Power BI and SQL, the learning curve is significantly flattened. This allows you to hit the ground running without a massive training budget.

Why Modernizing Your Data Architecture is a Critical Business Priority

Staying on legacy or overly complex platforms is a silent profit killer that erodes your margins through delayed decisions. If your data feels like a house of cards, you are likely losing significant profits due to fragmentation. Understanding modern business intelligence technology is vital to turning this around today.

  • Evaluating Your Current Stack

    The first major step is a brutal evaluation of your current technology stack. Don't rush to overhaul everything at once; instead, look for what is actually underutilized. Sometimes dashboards are largely ignored because they don't solve a real problem, so you must assess stakeholder needs first.

  • Mapping the Strategic Roadmap

    The second step is developing a clear roadmap with defined milestones. Using the correct migration fundamentals ensures that you don't repeat the mistakes of the past. Transparency builds trust with leadership, allowing them to track progress even if the change is gradual.

  • Establishing Robust Governance

    The third step is to prioritize rock-solid policies for data quality and security. By following expert tips for success, you build a system that people actually trust. Governance is the backbone that allows your team to rely on these insights every day.

  • Analyzing Architecture Differences

    Databricks offers incredible flexibility for high-intensity engineering but often requires heavy manual tuning. Fabric, however, is designed to be a persona-centric experience that feels natural to Microsoft users. Recent comparisons of these products show a clear shift toward this unified model.

  • Understanding Vendor Integration

    Microsoft has always been known for its massive ecosystem, and this new platform plays perfectly with Office and Teams. Databricks requires more effort to integrate with your daily productivity tools, which can create friction. For a lean team, having everything in one workspace is a game-changing efficiency.

  • Shifting the Culture

    Becoming data-driven is about more than just tech; it’s about changing the mindset of the entire company. You need every team member to not just use the data, but to actually live and breathe it. This cultural shift turns your data from a tough obstacle into your biggest ally in the competitive market.

  • Driving Business Value

    Don't be an average developer who just takes requests blindly and builds one-off reports that belong in the dump. Use this migration to ask deeper questions about what business objective you are trying to achieve. This approach ensures that every single report you build provides a tangible return on investment.

Databricks vs Microsoft Fabric: Feature Comparison Matrix

.bi-table-wrapper { overflow-x: auto; max-width: 100%; } .bi-table { width: 100%; min-width: 700px; border-collapse: collapse; margin: auto; background-color: #fff; color: black; box-shadow: 0 0 10px rgba(0,0,0,0.1); } .bi-table caption { caption-side: top; font-size: 1.6rem; font-weight: bold; padding: 1rem; color: #00897F; text-align: center; } .bi-table th, .bi-table td { padding: 12px 20px; text-align: center; border-bottom: 1px solid #ddd; } .bi-table th { background-color: #00897F; color: white; } .bi-table tr:hover { background-color: #f1f1f1; } .bi-table tbody tr:nth-child(even) { background-color: #f9f9f9; } @media (max-width: 600px) { .bi-table { min-width: 100%; } .bi-table caption { font-size: 1.2rem; padding: 0.75rem; } .bi-table th, .bi-table td { padding: 8px 10px; font-size: 0.9rem; } }
Feature Databricks Platform Microsoft Fabric SaaS
Management PaaS (Cluster Tuning) SaaS (Automated)
Integration Manual Connectors Native M365/D365
Compute Specialized Clusters Shared F-SKU Capacity
Interface Notebook Centric Persona/Wizard Based
Storage External Data Lake Central OneLake

The table above highlights how the move to a SaaS model reduces the overhead associated with cluster management. While Databricks remains powerful for niche engineering, Fabric provides the "all-in-one" environment that lean teams need. This consolidation allows you to stop juggling multiple vendors for storage and visualization.

Costs, Comparisons, and Implementation Timelines for Your Migration

You need to shift the conversation with the C-suite to show them that data is not just a cost center. Standing up a data warehouse used to be expensive and long when done by noobs, but that is changing. You can now deliver high-value analytics environments faster and more affordably than ever before.

  • Calculating the Total Investment

    What will it actually cost in money, time, and licensing to make this move? You can find detailed pricing structures that explain how to leverage your existing agreements. This transparency is crucial when you are asking the CFO for the budget to meet your team's request demands.

  • Managing Capacity Needs

    To avoid any guesswork, you should use a modern capacity estimator to plan your spend accurately. This tool helps you set realistic expectations with leadership and prevents budget overruns. It ensures that you have exactly the resources you need without paying for idle compute time.

  • Predicting Annual Expenses

    Licensing for this ecosystem is often more predictable because it uses a fixed capacity model rather than variable clusters. This helps you avoid the "bill shock" that often comes with high-intensity cloud engineering projects. For an SMB, this financial predictability is a major component of a successful strategy.

  • Optimizing Team Efficiency

    The time investment for your team is also reduced because you aren't spending hours on infrastructure setup. By automating the plumbing, you free up your people to focus on data storytelling and problem-solving. This shift in focus is what ultimately turns your data chaos into long-term strategic clarity.

Financial and Resource Impact

.bi-table-wrapper { overflow-x: auto; max-width: 100%; } .bi-table { width: 100%; min-width: 700px; border-collapse: collapse; margin: auto; background-color: #fff; color: black; box-shadow: 0 0 10px rgba(0,0,0,0.1); } .bi-table caption { caption-side: top; font-size: 1.6rem; font-weight: bold; padding: 1rem; color: #00897F; text-align: center; } .bi-table th, .bi-table td { padding: 12px 20px; text-align: center; border-bottom: 1px solid #ddd; } .bi-table th { background-color: #00897F; color: white; } .bi-table tr:hover { background-color: #f1f1f1; } .bi-table tbody tr:nth-child(even) { background-color: #f9f9f9; } @media (max-width: 600px) { .bi-table { min-width: 100%; } .bi-table caption { font-size: 1.2rem; padding: 0.75rem; } .bi-table th, .bi-table td { padding: 8px 10px; font-size: 0.9rem; } }
Expense Type Databricks Model Microsoft Fabric Model
Licensing Per Unit/Cluster Per Capacity (F-SKU)
Setup Time 4-6 Weeks 1-2 Weeks
Maintenance High (DevOps focus) Low (SaaS focus)
Training Niche Spark Skills Power BI/SQL Skills

This financial summary shows that the primary savings come from a reduction in both setup time and ongoing maintenance. By leveraging a SaaS environment, your lean team can achieve much more without increasing your headcount. This makes becoming a data-powered organization a much more realistic goal for smaller firms.

  • The Real-World Difference

    What is the real-world difference between these two major players when you are in the trenches? A technical deep dive explains that the ease of use is the defining factor. You don't need a whole engineering team just to migrate and access your core business data anymore.

  • Ensuring Data Sovereignty

    Trust is everything, and knowing that Microsoft is a leader in sovereign cloud platforms provides peace of mind. Your data is protected by world-class security protocols, which is a non-negotiable requirement for modern businesses. This trust allows your team to move faster with confidence.

  • Simplifying Daily Workflows

    In a typical Databricks environment, you might bounce between different tools for storage, engineering, and final visualization. Fabric keeps you in a single browser tab, which drastically reduces the context switching that kills productivity. It feels more like a cohesive product than a collection of separate technologies.

  • Enhancing Collaboration

    When your departments co-own datasets without centralizing control, you break down the silos that slow you down. Shared insights, like an order-to-cash report, help different teams work together toward a common goal. This collaboration is what turns a disorganized team into a high-performing powerhouse.

Platform Performance Comparison

.bi-table-wrapper { overflow-x: auto; max-width: 100%; } .bi-table { width: 100%; min-width: 700px; border-collapse: collapse; margin: auto; background-color: #fff; color: black; box-shadow: 0 0 10px rgba(0,0,0,0.1); } .bi-table caption { caption-side: top; font-size: 1.6rem; font-weight: bold; padding: 1rem; color: #00897F; text-align: center; } .bi-table th, .bi-table td { padding: 12px 20px; text-align: center; border-bottom: 1px solid #ddd; } .bi-table th { background-color: #00897F; color: white; } .bi-table tr:hover { background-color: #f1f1f1; } .bi-table tbody tr:nth-child(even) { background-color: #f9f9f9; } @media (max-width: 600px) { .bi-table { min-width: 100%; } .bi-table caption { font-size: 1.2rem; padding: 0.75rem; } .bi-table th, .bi-table td { padding: 8px 10px; font-size: 0.9rem; } }
Performance Metric Databricks Capability Microsoft Fabric Capability
In-Memory Speed High (Photon Engine) High (VertiPaq/Direct Lake)
Data Movement Required for Viz Zero Copy (Shortcuts)
Access Time Batch Processing Darn-Near-Real-Time
User Adoption Technical Teams Entire Organization

The operational data above proves that while both tools are fast, the "zero-copy" nature of the newer platform is a game-changer. It removes the need to wait for long import processes before you can start building your reports. This speed allows your team to respond to business requests in minutes, not days.

  • Standing Up Production Reports

    How long does it actually take to stand up a production environment for your top three reports? By staying current with the latest feature summaries, you can leverage automation to build pipelines in record time. Most teams can go from raw ingestion to live dashboards in just a few weeks.

  • Planning for the Future

    Using advanced planning tools allows you to move from historical data to actually forecasting the future. This level of insight was once reserved only for the largest enterprises with massive IT budgets. Now, even a lean team can provide these sophisticated analytics to their leadership.

  • Avoiding Project Failure

    The key to a fast deployment is understanding the reasons behind previous project failures before you begin. Ask direct questions about what went wrong in the past so you can avoid repeating those same mistakes. This reflection provides a clearer path forward and ensures your first migration project is a win.

  • Achieving Tangible Results

    Once you achieve results, you must share these successes with leadership to build continued support for your data strategy. Highlighting how your efficiency shot through the roof demonstrates your commitment to providing value. This transparency ensures you have the resources needed for your next major project.

Implementation Velocity Timeline

.bi-table-wrapper { overflow-x: auto; max-width: 100%; } .bi-table { width: 100%; min-width: 700px; border-collapse: collapse; margin: auto; background-color: #fff; color: black; box-shadow: 0 0 10px rgba(0,0,0,0.1); } .bi-table caption { caption-side: top; font-size: 1.6rem; font-weight: bold; padding: 1rem; color: #00897F; text-align: center; } .bi-table th, .bi-table td { padding: 12px 20px; text-align: center; border-bottom: 1px solid #ddd; } .bi-table th { background-color: #00897F; color: white; } .bi-table tr:hover { background-color: #f1f1f1; } .bi-table tbody tr:nth-child(even) { background-color: #f9f9f9; } @media (max-width: 600px) { .bi-table { min-width: 100%; } .bi-table caption { font-size: 1.2rem; padding: 0.75rem; } .bi-table th, .bi-table td { padding: 8px 10px; font-size: 0.9rem; } }
Phase Estimated Duration Key Deliverable
Foundation 1 Week Tenant & OneLake Setup
Engineering 2 Weeks Top 3 Pipeline Migration
Reporting 1 Week Real-Time Dashboard Live
Adoption 1 Week Stakeholder Training

The timeline demonstrates that a focused lean team can move from concept to a live production environment in about five weeks. This rapid speed to market is essential for staying competitive in today's fast-paced business world. It allows you to prove the value of your data initiatives almost immediately to the C-suite.

Turning Your Data into a Strategic Ally for Long-Term Growth

Transforming your organization into a powerhouse is a massive undertaking, but the rewards are worth the effort. By choosing a unified platform, you are setting a foundation that can grow with your needs while maintaining security. You are moving toward a future where data drives every single strategic move you make.

  • Killing the PDF Culture

    If your risk dashboard is still a PDF, you are falling behind your competitors who are using real-time insights. You must overhaul your mindset and stop providing static reports that are weeks too late to be useful. It’s time to embrace dynamic, interactive dashboards that your team actually relies on every day.

  • Building Custom Systems

    We believe that data can be either your biggest ally or your toughest obstacle, depending on how you manage it. That is why we focus on building systems that are customized for each specific client rather than taking a one-size-fits-all approach. This ensures that the technology actually solves your unique business problems.

  • Fostering a Data-First Mindset

    Get every team member to not just use the data, but to actually live and breathe it as the backbone of the operation. This shift can have a massive impact on your efficiency and your ability to outclass your rivals. When data is the core of your culture, your organization becomes more resilient and much more agile.

  • Solving the House of Cards

    If your data feels like it’s about to collapse, don't wait for the next gust of wind to blow it all down. Our mission is to help you turn that chaos into clarity by modernizing your stack and simplifying your workflows. We want to see your team succeed and your business thrive in the new data-driven economy.

  • Taking the Next Step Today

    What is the one process you are overhauling this month to turn your data chaos into a competitive advantage? Whether it’s killing a legacy system or investing in better governance, the time to act is right now. You don't have to navigate this complex landscape alone while you are trying to lead your organization.

Start Your Journey with Expert Microsoft Fabric Consultancy Services

Allston Yale has the expertise to help you figure out how to make this transition smooth and successful for your specific business needs. Book a free data check-up and let’s talk about how our Microsoft Fabric consultancy services can start turning your data into your biggest asset.

Sources

How to Start with Microsoft Fabric

How to Start with Microsoft Fabric

Weave Intelligent Insights with Microsoft Fabric

Discover the power of Microsoft Fabric and unify your data effortlessly. This guide shows you how to start with Microsoft Fabric, helping your team connect, analyze, and act faster while reducing data duplication and complexity across cloud environments.

Make sense of your business data with clear, interactive visuals. This page explains what is Power BI, how it works, and why Allston Yale recommends it for any organization seeking actionable insight and informed strategy.

Allston Yale Serves Businesses in Texas and across the USA

Grasping Microsoft Fabric

Microsoft Fabric is a unified analytics platform that integrates data across services like OneLake, Power BI, and Synapse. By connecting to multiple sources, it simplifies analytics workflows, centralizes storage, and enables scalable insights for faster, smarter decisions 

Assessing Data Platform Features

Before diving in, it’s essential to understand how Microsoft Fabric compares to other popular platforms. The table below highlights key differences in data access, analytics speed, integration, and collaboration capabilities to help you make an informed choice

Fabric vs Synapse vs Redshift
Feature Microsoft Fabric Azure Synapse AWS Redshift
Unified Data OneLake unifies data for all workloads, eliminating extra copies Synapse integrates Azure data, separate setups may be required Redshift uses cluster storage, limited cross-cloud integration
Analytics Speed Direct connections reduce latency and speed workflows Parallel queries enhance performance in Azure environments Columnar storage improves performance for big datasets
Permissions Centralized access controls simplify security Role-based Azure permissions must be configured individually IAM policies manage access across Redshift clusters
Cross-Cloud Connects Azure, AWS, and other sources seamlessly Primarily Azure-native, limited cross-cloud Requires additional tools for multi-cloud integration
  • Data Centralization

    Data Centralization

    Microsoft Fabric’s OneLake ensures all data is accessible from a single virtual lake, reducing redundant copies and simplifying access for all workloads.

  • Speed of Analysis

    Speed of Analysis

    Direct connections and shortcuts in Microsoft Fabric accelerate workflows, reducing latency and enabling near real-time insights for analytics across platforms

  • Access Control

    Access Control

    Centralized access management in Fabric streamlines credentials and governance, minimizing configuration errors compared to managing individual roles in other platforms.

  • Cross-Cloud Interoperability

    Cross-Cloud Interoperability

    Fabric integrates seamlessly with Azure, AWS, and external sources, providing multi-cloud analytics without additional setup, unlike Synapse or Redshift

How Microsoft Fabric Services Elevate Your Data

Allston Yale’s Microsoft Fabric Services streamline your analytics and data workflows. By adopting our services, organizations experience centralized storage, reduced duplication, improved governance, seamless cloud integration, faster insights, and simplified access management.

  • Centralized Storage

    Consolidate all enterprise data in OneLake for streamlined management, effortless collaboration, and smooth access across teams and workloads, reducing complexity and enhancing efficiency.

  • Reduced Duplication

    OneLake shortcuts and unified storage cut down on unnecessary data copies, lowering storage costs and minimizing processing delays, while keeping analytics workflows clean and efficient.

  • Faster Insights

    Direct connections through Microsoft Fabric accelerate data workflows, allowing teams to access accurate insights quickly and make informed, strategic decisions without waiting on slow data transfers.

  • Simplified Governance

    Centralized permission and credential management in OneLake reduces configuration errors, ensures consistent security, and keeps compliance intact across all workloads and analytical processes.

  • Multi-Cloud Integration

    Microsoft Fabric enables seamless integration with Azure, AWS, and other platforms, providing true cross-cloud analytics and eliminating the need for complex multi-cloud setups or duplicate pipelines.

  • Enhanced Collaboration

    Teams can securely access, share, and analyze data from a single source in OneLake, boosting productivity, breaking down silos, and enabling more coordinated, data-driven decisions.

How to Start with Microsoft Fabric, Contact Allston Yale

Start your journey with Microsoft Fabric and unlock the full potential of unified analytics. Allston Yale ensures smooth implementation, centralized data access, and faster insights. Contact us today to schedule your consultation on how to start with Microsoft Fabric.

How To Transition Your Business from AWS to Microsoft Fabric to Save Time and Money

How To Transition Your Business from AWS to Microsoft Fabric to Save Time and Money

Moving from the complex web of AWS services to the unified SaaS environment of Microsoft Fabric represents a massive shift for lean IT departments. This transition allows your small team to focus on delivering high value insights instead of wasting countless hours managing fragmented cloud infrastructure.

Allston Yale Serves Businesses in Texas and across the USA

Why Modernizing Your Data Stack is Essential for Survival

Small IT teams often feel like they have to be superman to manage infrastructure, security, and analytics simultaneously. Juggling different vendors for ingestion, storage, and visualization is a total pain that slows down your business. Microsoft Fabric brings everything together into a single workspace to help you scale.

  • Breaking The Cycle Of Engineering Debt

    When you rely on a sprawling AWS environment, you often find yourself buried under specialized tasks that require a massive engineering team. Moving to a unified platform means you can stop acting like a mechanic for your data pipes. You can start acting like a true strategic partner to your business leaders.

  • The SaaS Advantage For Small Teams

    The primary difference between these platforms is the shift from a PaaS model to a true SaaS experience for your data. While AWS requires you to stitch together various services, Fabric provides an integrated environment that simplifies the entire lifecycle. Your team can spend more time solving problems.

  • Reducing Operational Friction

    Complexity is the silent profit killer in many organizations because it creates silos that are nearly impossible to break down. By centralizing your data into OneLake, you eliminate the need to move data between different specialized engines. This efficiency gain is massive for teams that only have a few people available.

Comparing AWS and Microsoft Fabric Features

.bi-table-wrapper { overflow-x: auto; max-width: 100%; } .bi-table { width: 100%; min-width: 700px; border-collapse: collapse; margin: auto; background-color: #fff; color: black; box-shadow: 0 0 10px rgba(0,0,0,0.1); } .bi-table caption { caption-side: top; font-size: 1.6rem; font-weight: bold; padding: 1rem; color: #00897F; text-align: center; } .bi-table th, .bi-table td { padding: 12px 20px; text-align: center; border-bottom: 1px solid #ddd; } .bi-table th { background-color: #00897F; color: white; } .bi-table tr:hover { background-color: #f1f1f1; } .bi-table tbody tr:nth-child(even) { background-color: #f9f9f9; } @media (max-width: 600px) { .bi-table { min-width: 100%; } .bi-table caption { font-size: 1.2rem; padding: 0.75rem; } .bi-table th, .bi-table td { padding: 8px 10px; font-size: 0.9rem; } }
Feature Amazon Web Services (AWS) Microsoft Fabric
Service Model Infrastructure and Platform (PaaS) Software as a Service (SaaS)
Data Storage Amazon S3 (Object Storage) OneLake (Unified Data Lake)
Compute Engine Multiple (Redshift, Athena, EMR) Unified (SQL, Spark, Kusto)
Integration Manual via Glue or AppFlow Native via Data Factory
User Experience Technical AWS Console Intuitive Power BI Style UI
Governance AWS Lake Formation Microsoft Purview Integration

This table highlights how AWS focuses on granular control through separate services while Fabric prioritizes a unified experience. You can see that moving to Fabric shifts the burden of integration from your IT team to the platform itself. This allows your people to focus on data quality instead of managing server configurations.

Calculating the Real Investment for Your Organization

What will it cost in money, time, and licensing? This is the first question every CFO will ask when you propose a major migration project. You need to present a clear picture of the pricing structures involved to get the green light. Total cost of ownership is about more than a monthly bill.

Navigating The Licensing Maze

The licensing model for Fabric is unique because it centers on capacity rather than individual service costs. You can leverage existing Microsoft 365 E5 licenses to start exploring some of the features for free. This makes it much easier to prove value before you commit to a larger enterprise investment for the team.

Estimating The Migration Timeline

Time is your most precious resource when you are running a lean operation with limited headcount. A standard migration for a mid-sized business typically takes between three and six months to fully complete. However, you can achieve early wins by focusing on high impact reports during the initial weeks of the project.

Cost and Resource Summary

.bi-table-wrapper { overflow-x: auto; max-width: 100%; } .bi-table { width: 100%; min-width: 700px; border-collapse: collapse; margin: auto; background-color: #fff; color: black; box-shadow: 0 0 10px rgba(0,0,0,0.1); } .bi-table caption { caption-side: top; font-size: 1.6rem; font-weight: bold; padding: 1rem; color: #00897F; text-align: center; } .bi-table th, .bi-table td { padding: 12px 20px; text-align: center; border-bottom: 1px solid #ddd; } .bi-table th { background-color: #00897F; color: white; } .bi-table tr:hover { background-color: #f1f1f1; } .bi-table tbody tr:nth-child(even) { background-color: #f9f9f9; } @media (max-width: 600px) { .bi-table { min-width: 100%; } .bi-table caption { font-size: 1.2rem; padding: 0.75rem; } .bi-table th, .bi-table td { padding: 8px 10px; font-size: 0.9rem; } }
Investment Category Estimated Requirement Key Consideration
Direct Licensing F2 to F64 SKUs Capacity can be paused or scaled
Implementation Time 3 to 6 Months Phased approach is highly recommended
Internal Effort 1 to 2 Data Leads Focus on architecture and governance
External Support 1 Specialist Partner Accelerates the initial setup phase

The table demonstrates that while there is a significant time commitment, the licensing is flexible and scalable for your needs. Lean IT teams should focus on the ability to pause capacity to manage costs during periods of low activity. This level of control is game-changing for businesses that need to remain agile and lean.

Evaluating Capacity and the Right SKU for Your Business

What is the real-world difference between AWS and Microsoft Fabric Capacity (F-SKUs)? Understanding the power behind these units is vital for maintaining performance. Unlike the traditional Redshift nodes, F-SKUs represent a shared pool of compute that dynamically allocates resources where they are needed most.

The Flexibility Of Compute Units

One of the coolest facts about Fabric is how it handles varied workloads without requiring manual intervention from your team. You don’t have to worry about sizing a specific cluster for a specific task anymore. The capacity manages the peaks and valleys of your data processing needs automatically and efficiently.

Capacity Performance Comparison

.bi-table-wrapper { overflow-x: auto; max-width: 100%; } .bi-table { width: 100%; min-width: 700px; border-collapse: collapse; margin: auto; background-color: #fff; color: black; box-shadow: 0 0 10px rgba(0,0,0,0.1); } .bi-table caption { caption-side: top; font-size: 1.6rem; font-weight: bold; padding: 1rem; color: #00897F; text-align: center; } .bi-table th, .bi-table td { padding: 12px 20px; text-align: center; border-bottom: 1px solid #ddd; } .bi-table th { background-color: #00897F; color: white; } .bi-table tr:hover { background-color: #f1f1f1; } .bi-table tbody tr:nth-child(even) { background-color: #f9f9f9; } @media (max-width: 600px) { .bi-table { min-width: 100%; } .bi-table caption { font-size: 1.2rem; padding: 0.75rem; } .bi-table th, .bi-table td { padding: 8px 10px; font-size: 0.9rem; } }
SKU Level Capacity Units (CU) Typical Use Case
F2 - F4 2 - 4 CU Development and small test environments
F8 - F16 8 - 16 CU Small production workloads with few users
F32 - F64 32 - 64 CU Mid-sized enterprise with Copilot needs
F128+ 128+ CU Large scale data warehousing operations

This comparison shows that capacity units scale linearly to provide more power as your data requirements grow over time. Most lean IT teams will start small and scale up as they move more production workloads into the environment. It’s a much more forgiving model than purchasing fixed hardware or locked in cloud instances.

Finding the Sweet Spot for Mid-sized Growth

Which Fabric SKU is the "sweet spot" for a mid-sized business? For most organizations, the F64 SKU is the gold standard because it unlocks the full potential of the platform. This specific level is where you gain access to advanced features like Copilot and free Power BI Pro content distribution for users.

Unlocking the power of AI

Choosing the right entry point is crucial because it determines which features are available to your end users. The F64 SKU provides enough horsepower to run complex data pipelines while also supporting a large number of concurrent report viewers. It represents the best balance of cost and functionality.

Sweet Spot SKU Details

.bi-table-wrapper { overflow-x: auto; max-width: 100%; } .bi-table { width: 100%; min-width: 700px; border-collapse: collapse; margin: auto; background-color: #fff; color: black; box-shadow: 0 0 10px rgba(0,0,0,0.1); } .bi-table caption { caption-side: top; font-size: 1.6rem; font-weight: bold; padding: 1rem; color: #00897F; text-align: center; } .bi-table th, .bi-table td { padding: 12px 20px; text-align: center; border-bottom: 1px solid #ddd; } .bi-table th { background-color: #00897F; color: white; } .bi-table tr:hover { background-color: #f1f1f1; } .bi-table tbody tr:nth-child(even) { background-color: #f9f9f9; } @media (max-width: 600px) { .bi-table { min-width: 100%; } .bi-table caption { font-size: 1.2rem; padding: 0.75rem; } .bi-table th, .bi-table td { padding: 8px 10px; font-size: 0.9rem; } }
Requirement Recommended SKU Why It Works
Copilot Access F64 or Higher Required for AI assisted development
Report Sharing F64 or Higher Allows users without Pro licenses to view
Concurrency 64 Capacity Units Handles multiple large refreshes at once

As the table shows, the F64 SKU is the point where the platform truly becomes an enterprise-grade solution for your company. It simplifies the licensing for your viewers because you no longer need to buy individual Pro licenses for everyone. This shift often offsets the cost of the capacity itself for many organizations.

Building Your First Production Environment Quickly

How long does it actually take to stand up a production environment for your top 3 reports? If you use a structured approach, you can have your first high-impact dashboards running in as little as four to six weeks. This rapid turnaround is essential for building trust with your leadership and stakeholders.

Prioritizing High Value Wins

You should avoid the mistake of trying to move everything at once because that leads to project fatigue and failure. Instead, identify the reports that the CEO or CFO uses every day to make massive strategic moves. By delivering these first, you prove the value of the new platform and secure future support.

Utilizing Existing Cloud Assets

The transition is much faster when you utilize OneLake shortcuts to access your data without moving it. This nifty feature allows you to point Fabric at your existing AWS S3 buckets to start building reports immediately. You can bypass the long ingestion phase and get straight to the analysis.

Rapid Deployment Timeline

.bi-table-wrapper { overflow-x: auto; max-width: 100%; } .bi-table { width: 100%; min-width: 700px; border-collapse: collapse; margin: auto; background-color: #fff; color: black; box-shadow: 0 0 10px rgba(0,0,0,0.1); } .bi-table caption { caption-side: top; font-size: 1.6rem; font-weight: bold; padding: 1rem; color: #00897F; text-align: center; } .bi-table th, .bi-table td { padding: 12px 20px; text-align: center; border-bottom: 1px solid #ddd; } .bi-table th { background-color: #00897F; color: white; } .bi-table tr:hover { background-color: #f1f1f1; } .bi-table tbody tr:nth-child(even) { background-color: #f9f9f9; } @media (max-width: 600px) { .bi-table { min-width: 100%; } .bi-table caption { font-size: 1.2rem; padding: 0.75rem; } .bi-table th, .bi-table td { padding: 8px 10px; font-size: 0.9rem; } }
Phase Duration Key Outcome
Infrastructure Week 1 Capacity is set up and OneLake is live
Data Connectivity Week 2 Shortcuts are created to existing AWS S3
Modeling Weeks 3-4 Direct Lake models are built for speed
Visualization Weeks 5-6 Top 3 reports are validated and shared

The table illustrates that a six-week timeline is entirely realistic for a focused team using modern features. By leveraging shortcuts, you eliminate the most time-consuming part of traditional data projects which is moving the data. This allows your team to function like a much larger department and deliver results.

Ensuring a Successful First Migration Project

What are the three non-negotiable steps to ensure the first migration project is a success? You must start with a comprehensive assessment of your current state to identify any potential blockers early. Skipping the planning phase is a recipe for a house of cards that will eventually collapse.

Establishing Rock Solid Governance

Data governance cannot be an afterthought if you want people to actually trust and use the dashboards you build. You need to establish clear policies for data quality and security from the very first day. This builds a foundation of trust that allows your organization to become truly data driven in its decisions.

Engaging With Your Stakeholders

Before you touch any code, take the time to understand what problems your business leaders are trying to solve. Asking deep questions helps you avoid building reports that will simply gather dust in a digital corner. You want to create tools that people rely on every single day to do their jobs better.

Three Non-Negotiable Steps

.bi-table-wrapper { overflow-x: auto; max-width: 100%; } .bi-table { width: 100%; min-width: 700px; border-collapse: collapse; margin: auto; background-color: #fff; color: black; box-shadow: 0 0 10px rgba(0,0,0,0.1); } .bi-table caption { caption-side: top; font-size: 1.6rem; font-weight: bold; padding: 1rem; color: #00897F; text-align: center; } .bi-table th, .bi-table td { padding: 12px 20px; text-align: center; border-bottom: 1px solid #ddd; } .bi-table th { background-color: #00897F; color: white; } .bi-table tr:hover { background-color: #f1f1f1; } .bi-table tbody tr:nth-child(even) { background-color: #f9f9f9; } @media (max-width: 600px) { .bi-table { min-width: 100%; } .bi-table caption { font-size: 1.2rem; padding: 0.75rem; } .bi-table th, .bi-table td { padding: 8px 10px; font-size: 0.9rem; } }
Step Action Item Success Metric
1. Assessment Audit existing AWS workloads Clear list of priorities and blockers
2. Architecture Design the OneLake structure Zero data duplication across the team
3. Training Enable the end users High adoption rates for new dashboards

Following these steps ensures that your migration is not just a technical change but a business transformation. The table highlights that success is measured by adoption and clarity rather than just technical completion. A lean team succeeds by being more strategic and organized than their larger competitors who waste time.

Navigating The Complexities Of Data Modernization

Modernizing your data stack is a massive undertaking that requires a strategic partner to navigate successfully. You need to ensure that your team is prepared for the shift in mindset that a SaaS platform requires. It’s about moving from managing servers to managing insights and value for the company.

  • Learning From The Industry Leaders

    Successful organizations have shown that a phased approach is the most effective way to handle a platform shift. You can avoid the common pitfalls by following established best practices from those who have already made the jump. Lean teams must be smarter about how they allocate their limited time and energy.

  • Understanding The Financial Impact

    The shift to a capacity-based model requires a detailed guide to ensure you are not overspending on unnecessary resources. You should monitor your usage closely during the first few months to find the perfect balance for your specific workloads. This proactive management keeps your costs low while keeping performance high.

  • Building A Future Proof Foundation

    By following the fundamentals of migration, you can build a system that scales as your business grows. You will no longer be limited by the technical debt of a disjointed and messy infrastructure. Your data will become your biggest ally instead of your toughest obstacle in the coming years.

  • Turning Your Data Into A Strategic Asset

    Transforming your organization into a data driven powerhouse is exhausting but the results are absolutely game changing. You can lead your company toward a future where every single strategic move is backed by cold hard data. It’s time to stop the manual spreadsheets and start trusting your insights again.

Reach Out to Your Strategic Partner & Microsoft Fabric Consultant

If your current data environment feels like a total mess and you want to turn it into a strategic asset, Allston Yale is here to help. You can gain clarity and confidence in your analytics by working with a Microsoft Fabric consultant that understands your unique challenges. Take the first step toward a better data future and book a free data check up with us right now!

Sources

Microsoft Fabric vs Amazon Redshift: Which Cloud Data Platform Should Your Business Choose

Microsoft Fabric vs Amazon Redshift: Which Cloud Data Platform Should Your Business Choose?

The selection between Microsoft Fabric and Amazon Redshift ultimately hinges on whether your organization prioritizes a unified, SaaS-based ecosystem or a highly customizable, performance-tuned data warehouse. While Fabric excels in ease of use and deep Microsoft 365 integration, Redshift remains a powerhouse for massive SQL workloads.

Allston Yale Serves Businesses in Texas and across the USA

  • Platform Philosophies

    Microsoft Fabric represents a significant shift toward a simplified, all-in-one data experience that reduces the need for complex engineering. Conversely, Amazon Redshift is built for heavy-duty analytics, offering immense scalability for teams that require granular control over their compute resources and data structures.

  • Speed to Insights

    Fabric allows businesses to move from raw data to actionable Power BI dashboards with minimal friction using the Direct Lake feature. This bypasses traditional data movement, whereas Redshift often requires more robust mapping of cloud services to ensure that the data pipeline remains efficient and secure.

  • Scalability and Growth

    Organizations with massive, petabyte-scale data often lean toward the proven maturity of Amazon Redshift for its high-performance capabilities. However, Fabric is rapidly closing the gap by offering a simplified scaling model that accommodates growth without requiring a dedicated team of database administrators.

  • Strategic Decisions

    Choosing a platform is not merely a technical task but a strategic one that affects how every department interacts with critical information. Decision-makers must evaluate their existing investments, as those already deep in the Microsoft stack will find Fabric offers a path that turns data into a competitive advantage.

  • The Bottom Line

    Ultimately, Fabric is designed for speed and simplicity, making it ideal for lean IT teams that need to deliver value quickly. Redshift is the go-to for specialized environments where engineers need to squeeze every bit of performance out of their SQL queries to support complex, large-scale business operations.

The Strategic Importance of Each Platform

Modern data infrastructure can either be a silent profit killer or a powerful engine for growth, depending on how it’s implemented and managed. Firms that fail to modernize often lose significant annual margins due to delayed decisions caused by fragmented data, making the choice of a primary platform absolutely vital.

  • Silent Profit Killers

    Manual spreadsheets and disjointed ERP systems act as a house of cards that can collapse under the slightest business pressure. When procurement data remains stale in legacy systems, procurement teams miss critical cost spikes, leading to budget overruns that could have been avoided with real-time, unified data insights.

  • Legacy System Risks

    Static reporting in Excel remains a major bottleneck for mid-sized firms, as it prevents non-technical teams from interpreting basic analytics effectively. Relying on outdated workflows means that by the time a budget overrun is spotted, it is often weeks too late to implement any meaningful corrective measures.

  • Data Mesh Adoption

    Breaking down organizational silos through a data mesh approach allows different teams to co-own their datasets without losing central control. This strategy turns resistant architects and managers into data advocates, ensuring that the technology stack serves the business goals rather than becoming an obstacle.

  • Fabric Strengths

    The primary advantage of Microsoft Fabric is its ability to provide a "OneLake" environment that serves as a single source of truth for the company. This strategic architectural difference eliminates the need to bounce between different vendors for storage, engineering, and visualization tasks.

  • Fabric Cons

    Despite its rapid growth, Microsoft Fabric is still a relatively young platform, meaning some features are still maturing compared to established rivals. Some advanced users may find the SaaS nature of the tool limits their ability to fine-tune the underlying hardware for highly specific or unusual data processing tasks.

  • Redshift Pros

    Amazon Redshift is a battle-tested solution that offers incredible performance for massive datasets and complex analytical queries. It provides engineers with the tools needed to optimize storage and compute separately, which is essential for modernizing the data warehouse at a massive scale.

  • Redshift Cons

    The complexity of Redshift can be a double-edged sword, as it often requires a specialized team of data engineers to maintain and optimize the environment. For smaller organizations, the administrative overhead and the need for manual performance tuning can turn the platform into an expensive and slow-moving cost center.

  • Business Alignment

    Data must serve the people, and any technology choice should focus on solving specific business problems rather than just building sophisticated environments. CIOs must ensure that leadership is genuinely supportive of becoming data-driven, as this commitment is vital for securing the resources needed for success.

  • Technical Flexibility

    Redshift provides a level of technical depth that is hard to match, allowing for intricate configurations that cater to specific performance needs. This flexibility is perfect for organizations that have the engineering talent to manage the key operational distinctions between various cloud storage and compute layers.

  • Team Efficiency

    Fabric is designed to make data engineering more accessible, potentially reducing the reliance on a large team of specialized developers. By automating many of the traditional pipeline tasks, it allows lean teams to focus more on delivering business value and less on managing the underlying infrastructure daily.

  • Infrastructure Modernization

    Modernizing a chaotic infrastructure requires a structured approach that prioritizes stakeholder needs over simply buying the latest tools. Whether choosing Fabric or Redshift, the goal should always be to turn data into a strategic asset that provides clarity and allows the organization to outclass its competitors.

  • Stakeholder Engagement

    Before diving into any technical solution, it’s essential to understand what stakeholders truly want from their data and what problems they face. This insight shapes the entire strategy and ensures that the chosen platform, whether from Microsoft or Amazon, actually solves the business challenges at hand.

  • Setting Expectations

    Transparency is crucial when communicating the timeline and costs of a major data platform migration to company leadership. Developing a clear roadmap with measurable milestones allows executives to track progress and builds the trust necessary to sustain long-term investments in high-quality data infrastructure and AI.

  • Analyzing Failures

    Understanding why previous data projects failed can prevent a company from repeating the same mistakes during a move to Fabric or Redshift. Digging into the root causes of past issues provides a clearer path forward and helps the organization develop a more resilient and effective data management strategy.

  • Communicating Wins

    As tangible results are achieved, sharing these successes with leadership demonstrates the value of the investment in a modern data platform. Highlighting how new dashboards or faster reports lead to better decisions builds the momentum needed to continue the journey toward becoming a data-driven powerhouse.

  • Data Governance Focus

    Establishing rock-solid policies for data quality and security is non-negotiable in today’s complex regulatory and threat landscape. Both platforms offer governance tools, but the organization must cultivate a culture where data is treated as the backbone of every strategic move and protected accordingly.

  • Scalable Infrastructure Needs

    Investing in systems that grow alongside the organization prevents the data environment from becoming a bottleneck during periods of rapid expansion. Choosing between a SaaS model and a managed cluster model involves long-term planning regarding how much data the business expects to process in the future.

  • Predictive Trends

    As we look toward 2026, the adoption of unified platforms like Fabric is expected to skyrocket as companies seek to simplify their stacks. Keeping an eye on market trends for 2026 helps CIOs make decisions that will remain relevant and supported as the cloud landscape continues to evolve rapidly.

Microsoft Fabric vs Amazon Redshift: Features and Philosophy

.bi-table-wrapper { overflow-x: auto; max-width: 100%; } .bi-table { width: 100%; min-width: 700px; border-collapse: collapse; margin: auto; background-color: #fff; color: black; box-shadow: 0 0 10px rgba(0,0,0,0.1); } .bi-table caption { caption-side: top; font-size: 1.6rem; font-weight: bold; padding: 1rem; color: #00897F; text-align: center; } .bi-table th, .bi-table td { padding: 12px 20px; text-align: center; border-bottom: 1px solid #ddd; } .bi-table th { background-color: #00897F; color: white; } .bi-table tr:hover { background-color: #f1f1f1; } .bi-table tbody tr:nth-child(even) { background-color: #f9f9f9; } @media (max-width: 600px) { .bi-table { min-width: 100%; } .bi-table caption { font-size: 1.2rem; padding: 0.75rem; } .bi-table th, .bi-table td { padding: 8px 10px; font-size: 0.9rem; } }
Feature Microsoft Fabric Amazon Redshift
Service Model Software-as-a-Service (SaaS) Managed Platform-as-a-Service (PaaS)
Primary Philosophy Unified analytics with OneLake Scalable, high-performance SQL warehouse
Data Ownership Centralized in OneLake (Parquet/Delta) Managed storage with S3 integration
Integration Native with Office 365, Teams, Power BI Deep integration with the AWS ecosystem
Management Low administrative overhead Requires DBA/Performance tuning skills
Computing Logic Unified Capacity (CU) Node-based or Serverless clusters

The comparison table highlights the fundamental difference between a unified, low-maintenance SaaS approach and a high-control, performance-oriented warehouse. Microsoft Fabric is built to consolidate various data roles into a single workspace, while Amazon Redshift focuses on providing a powerful, scalable engine for complex SQL.

Detailed Analysis of Pricing Models and Operational Workflows

Understanding the financial and operational implications of each platform is essential for long-term budget planning and team productivity. Pricing models vary significantly, ranging from predictable capacity-based costs to more variable usage-based nodes that require constant monitoring to avoid budget surprises.

  • Capacity Based Pricing

    Microsoft Fabric utilizes a capacity-based model where businesses purchase "F-SKUs" that represent a certain amount of compute power. This model allows for more predictable monthly spending, which is often a major concern for CFOs looking to manage the costs of best-of-breed warehouse tools across the entire organization.

  • Performance and Nodes

    Amazon Redshift often relies on a node-based pricing structure where costs are determined by the number and type of instances in a cluster. This allows for extreme performance tuning, but it also means that costs can escalate quickly if the environment is not managed by an experienced data engineering professional.

  • Licensing Flexibility

    Many organizations can leverage existing Microsoft 365 E5 licenses to access some Fabric features, providing a cost-effective entry point. This licensing synergy makes Fabric an attractive option for companies already invested in the Microsoft ecosystem, as it reduces the need to procure entirely new software.

  • Serverless Options

    Both platforms offer serverless options that allow for automatic scaling based on the actual workload demands of the business. This is particularly useful for organizations with unpredictable data processing needs, ensuring that they only pay for the compute resources they actually use during peak periods of activity.

  • Reserved Instances

    For businesses with steady and predictable workloads, Amazon offers significant discounts through reserved instance pricing. By committing to a specific level of usage over a one-year or three-year term, companies can achieve substantial savings on Redshift pricing compared to standard on-demand rates.

  • Hidden Costs

    It is important to consider the total cost of ownership, including the salaries of the engineers needed to maintain the platform. While a platform might have lower licensing fees, the need for a large team to manage its complexity can make it more expensive than a simplified SaaS solution in the long run.

  • Global Scalability

    Operating across multiple regions requires a platform that can handle data residency and compliance requirements seamlessly. Both Microsoft and Amazon provide robust global infrastructures, but the ease of managing these cross-region deployments can vary depending on the specific administrative tools provided by each vendor.

  • Cost Control Tools

    Effective cost management requires visibility into how different departments and projects are consuming resources. Both platforms provide dashboards to track spending, but the unified nature of Fabric often makes it easier to allocate costs back to specific business units without complex tagging or reporting tools.

Microsoft Fabric vs Amazon Redshift: Pricing

.bi-table-wrapper { overflow-x: auto; max-width: 100%; } .bi-table { width: 100%; min-width: 700px; border-collapse: collapse; margin: auto; background-color: #fff; color: black; box-shadow: 0 0 10px rgba(0,0,0,0.1); } .bi-table caption { caption-side: top; font-size: 1.6rem; font-weight: bold; padding: 1rem; color: #00897F; text-align: center; } .bi-table th, .bi-table td { padding: 12px 20px; text-align: center; border-bottom: 1px solid #ddd; } .bi-table th { background-color: #00897F; color: white; } .bi-table tr:hover { background-color: #f1f1f1; } .bi-table tbody tr:nth-child(even) { background-color: #f9f9f9; } @media (max-width: 600px) { .bi-table { min-width: 100%; } .bi-table caption { font-size: 1.2rem; padding: 0.75rem; } .bi-table th, .bi-table td { padding: 8px 10px; font-size: 0.9rem; } }
Pricing Factor Microsoft Fabric Amazon Redshift
Primary Model Capacity-based (F-SKUs) Node-based or Serverless
Predictability High (Fixed monthly capacity) Variable (Based on usage and nodes)
Scaling Dynamic with capacity smoothing Manual or auto-scaling clusters
Cost Efficiency High for M365/E5 users High for large-scale reserved usage

This comparison shows that Microsoft Fabric offers more predictable, capacity-oriented costs that are ideal for corporate budgeting. Amazon Redshift provides more granular control over instance types, which can lead to significant savings for large, well-managed workloads but requires more active oversight to maintain cost efficiency.

  • Unified Ingestion

    The workflow in Microsoft Fabric is designed around the concept of a single workspace where data ingestion, transformation, and reporting all happen. This reduces the friction of moving data between different tools, which is a common complaint in more traditional, fragmented data architectures and environments.

  • Zero ETL Future

    Amazon is pushing toward a "Zero-ETL" future by creating tighter integrations between its various databases and the Redshift warehouse. This reduces the manual labor involved in creating data pipelines, allowing engineers to focus on higher-value tasks like peer-reviewed software comparisons and advanced data modeling projects.

  • Direct Lake Access

    One of the most innovative features of Fabric is Direct Lake mode, which allows Power BI to analyze data directly from OneLake. This eliminates the need to refresh datasets or move data into a separate memory layer, providing near-real-time insights that are crucial for fast-moving business environments today.

  • Advanced SQL Control

    Redshift provides an environment where SQL experts can utilize advanced features like distribution keys and sort keys to optimize query performance. This level of control is essential for complex analytical tasks that require processing billions of rows of data with the lowest possible latency for the end users.

  • Collaborative Workspaces

    Fabric facilitates better collaboration between data scientists, engineers, and business analysts by putting them all in the same environment. This break-down of silos ensures that everyone is working from the same source of truth, reducing the risk of conflicting reports and inconsistent business metrics.

  • Ecosystem Integration

    For organizations using AWS for their entire application stack, Redshift offers a level of integration with S3 and Glue that is hard to beat. The ability to query data directly in an S3 data lake using Redshift Spectrum provides a flexible and powerful way to manage vast amounts of unstructured information.

  • User Experience

    The user interface of Fabric is designed to be intuitive and familiar to anyone who has used Power BI or other Microsoft 365 tools. This lower barrier to entry allows more people within the organization to engage with the data, fostering a culture where data-driven decisions become the norm for everyone.

  • Developer Tooling

    Redshift supports a wide range of third-party tools and has a mature ecosystem of drivers and connectors. This makes it easy to integrate with existing BI tools or custom-built applications, providing a level of side-by-side feature ratings that gives developers the confidence to build complex, integrated data solutions.

Microsoft Fabric vs Amazon Redshift: Workflow Comparison

.bi-table-wrapper { overflow-x: auto; max-width: 100%; } .bi-table { width: 100%; min-width: 700px; border-collapse: collapse; margin: auto; background-color: #fff; color: black; box-shadow: 0 0 10px rgba(0,0,0,0.1); } .bi-table caption { caption-side: top; font-size: 1.6rem; font-weight: bold; padding: 1rem; color: #00897F; text-align: center; } .bi-table th, .bi-table td { padding: 12px 20px; text-align: center; border-bottom: 1px solid #ddd; } .bi-table th { background-color: #00897F; color: white; } .bi-table tr:hover { background-color: #f1f1f1; } .bi-table tbody tr:nth-child(even) { background-color: #f9f9f9; } @media (max-width: 600px) { .bi-table { min-width: 100%; } .bi-table caption { font-size: 1.2rem; padding: 0.75rem; } .bi-table th, .bi-table td { padding: 8px 10px; font-size: 0.9rem; } }
Workflow Phase Microsoft Fabric Amazon Redshift
Ingestion Data Factory / Dataflows Gen2 AWS Glue / COPY command
Transformation Spark / Synapse / SQL SQL / dbt / Stored Procedures
Storage OneLake (Open Delta Format) Redshift Managed Storage / S3
Reporting Native Power BI (Direct Lake) QuickSight / Tableau / External BI

This workflow table illustrates that Microsoft Fabric provides a more integrated, "one-stop-shop" experience for users, focusing on ease of use within a single interface. Amazon Redshift offers a more traditional but highly flexible approach that leverages the broader AWS ecosystem for ingestion and specialized transformation tasks.

Taking the Next Steps for Data Leadership

Deciding between Microsoft Fabric and Amazon Redshift is a major milestone in any company's journey toward becoming a data-driven powerhouse. While the technical details are important, the choice should ultimately be guided by how well the platform aligns with the business objectives and the skills of the existing team.

  • Making Data an Ally

    Data can be either the biggest ally or the toughest obstacle for a CEO or CIO trying to navigate a complex competitive landscape. By choosing the right platform, an organization can turn disorganized analytics into intuitive dashboards that the entire team can trust and rely on for making massive strategic moves daily.

  • Cultivating Data Culture

    Success depends on more than just technology; it requires a data-first culture where every team member lives and breathes insights. This cultural shift ensures that the investment in a platform like Fabric or Redshift translates into tangible business results and a significant increase in overall operational efficiency.

  • Avoiding Cost Centers

    Traditional data warehousing is often viewed as an expensive cost center because it takes too long to deliver value to the business. Modern platforms aim to change this perception by providing faster routes to insights, simplifying the decision path for leaders who need to justify their technology budgets to the board.

  • Problem Solving Focus

    A great data professional is not just someone who builds reports, but someone who acts as a problem solver for the business. They ask deeper questions about why a report is needed and how it will be implemented in daily processes, ensuring that the technology stack is used to achieve specific, measurable objectives.

  • Future Proofing

    As the cloud market evolves, staying flexible and informed is the best way to safeguard against future technical debt. Whether an organization chooses the unified SaaS path or the high-performance warehouse route, the focus must remain on building a scalable, secure, and governed environment that can grow with the company.

  • Strategic Summary

    Choosing the right data platform is about more than just features; it’s about choosing the future of how a business operates. Both Microsoft Fabric and Amazon Redshift offer incredible capabilities that can transform an organization, provided they are implemented with a clear strategy and a focus on delivering real value.

Choose Allston Yale for Trusted Microsoft Fabric Consultancy Services

The journey from data chaos to clarity is a massive undertaking that requires the right partnership and expertise from a trusted Microsoft Fabric consultancy. For those ready to stop the silent profit killers and start leveraging their data as a strategic asset, the next step is to book a free data check up with Allston Yale today.

Sources

Allston Yale Serves Businesses in Texas and across the USA